In my previous two posts I introduced System Center Advisor, created an online account and installed the on-site Gateway application (HERE), and then installed the monitoring Agent and configured it to monitor Lync (HERE). In this final post I show you the payoff – the details of my deployment in the System Center Advisor “Dashboard”, and check the health of the installation.
Overview
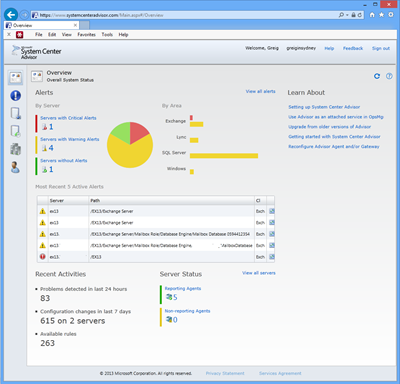
This is the view when you first log in after having setup the Gateway, Agents, and waited ~24 hours everyone to report in. 83 problems detected (ouch!), 5 reporting agents, and a pie-chart with not a lot of green! From here you can click on the pie chart’s slices or the highlighted areas to its left or right and Advisor will jump to the Alerts tab with that information presented to you.
Alerts
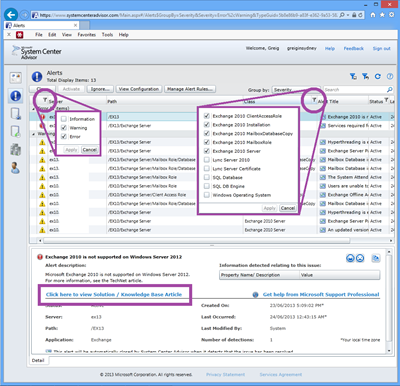
This is where all the fun happens. There’s lots you can do on the Alerts tab:
- Click the LH Filter icon to choose Errors, Warnings or Information messages
- Click the RH Filter icon to choose the products or rule types you want to see
- Select any of the alerts in the main part of the screen and be presented with the description at the bottom of the screen, with a link to the fix, which is often a detailed KB article or a Hotfix
- Choose the “Ignore…” or “Manage Alert Rules…” buttons up the top to tune the Alerts (the two images underneath this)
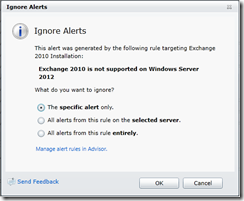
You can choose to ignore alerts: the specific alert only; all alerts from this rule on the selected server; or all alerts from this rule entirely. (I’m not sure if this particular alert is of my doing or a bug in the rules: it mistakenly identifies my Exchange 2013 server as Exchange 2010 and raises an error because I’ve used the ‘wrong’ OS):
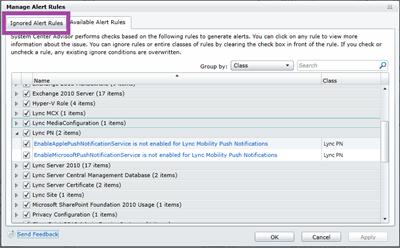
You can shop through the available rules here, as well as review and perhaps reinstate rules you’ve previously ignored:
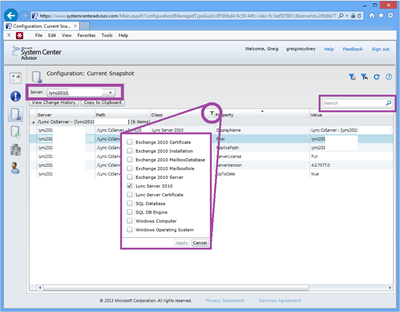
Configuration: Current Snapshot
Select the server you’re interested in, Filter, Search or copy the data to the Clipboard.
There’s quite a bit of info captured here. For my Lync 2010 & Exchange deployments it captures a handful of system parameters, and the details of each server’s certificates, including their expiry date.
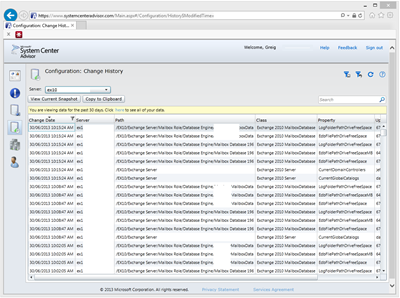
Configuration: Change History
The change history gives you just that. I found most of the data captured here is “underlying” stuff rather than config parameters changed by an Admin, so I didn’t find it all that useful. It may of course be developed in future updates.
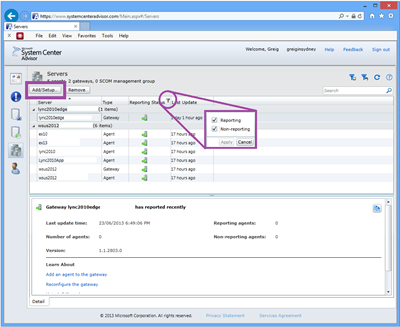
Servers
View your servers here. Check out when they last reported in, or filter just to show the ones you’ve not heard from.
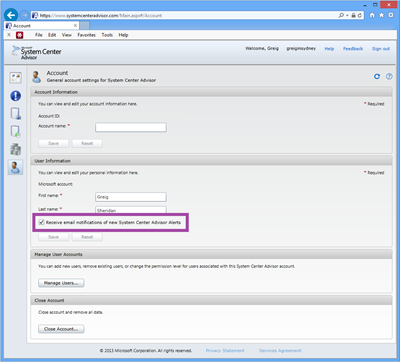
Account
Manage the account from here. Add new users (deciding if they’re an Administrator or User), and you’ll probably want to opt in to receiving e-mail notifications of new Alerts.
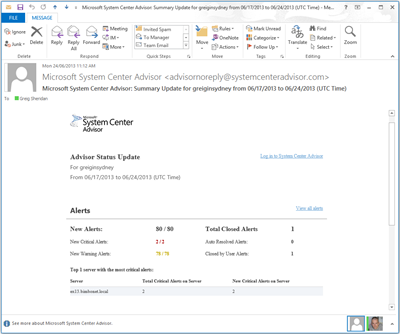
Here’s a very neat notification e-mail – you don’t suddenly find 80+ new messages in your Inbox. Like I said earlier, this isn’t SCOM! ;-)
Conclusions
I’m really impressed with this free service. Whilst its rule sets aren’t vast it still found plenty of deviations from best practice in my own lab that are worthy of review. Some alerts are for settings I have deliberately configured, so I’m going to Ignore them, but the suggested hotfixes and other config refinements will be researched (using the provided links) and perhaps rolled into my own future customer deployments. System Centre Advisor has already paid off in my Lab, highlighting two certificates that were a week off expiry…
