I recently introduced a script that monitors the Enphase solar setup we have here. This post is about the companion script that adds reporting down to an individual panel level.
- Get-EnphaseProduction.py. Queries the installation for an overview of production and consumption.
- Get-EnphaseData.py – this post. Queries the generation data for all of the invidual panels/micro-inverters.
- Get-EnphaseProduction-v7.py – the v7 version of this post. You’ll need this when your firmware is updated.
- Get-EnphaseData-v7.py – the v7 version of this post. You’ll need this when your firmware is updated.
Features
This script has the sole purpose of querying panel/inverter data from our Enphase solar system on a per-panel level. This enables us to confirm that all the panels are working properly and potentially identify any panels that aren’t pulling their weight.
As well as individual panel outputs, the script calculates and returns “panel range”. This is simply the difference between the highest and lowest output numbers. In normal operation, this number shouldn’t be very high as every panel pointing in the same direction should be generating roughly the same amount of power. If any of the panels drops output, the panel range number will increase. This will allow you to set up an alarm if any of the panel outputs drop for an extended amount of time. (Obviously you don’t want that time to be too short, as it would false-trigger on slow-moving clouds shading one or more of the panels while the rest remain in full sunlight.)
A caveat / word of warning
Enphase controls the firmware in your Envoy, and there seems to be quite a variety of versions in the wild. We’re on D5.0.62, and I know in some other countries they’re on v7.
I’ve seen reports that Enphase has possibly locked us out of local reporting of the Envoy in v7, so this script might not work for you. I’ll update this post with a note should our eventual upgrade to v7 break anything. It’s happened. The new script is here.
To determine your own Envoy version, login to the Enlighten website, click the hamburger then System / Devices / Gateway.
Pre-Requisites
The pre-requisites for this script are the same as for Get-EnphaseProduction.py:
- You need to know the IP address or hostname of your Enphase “Envoy” unit as well as the username and password for the default user.
- PRTG needs the “requests” module installed. If it’s not installed you’ll need to know the password for the default Windows Administrator account to install it.
- PRTG needs to be running on a release later than 22.2.77.2204:
PRTG Version 22.2.77.2204 broke compatibility with pip.exe install (to install Python packages). With this PRTG release we have removed support for this command to prevent unexpected errors. As of now the only supported way of installing a Python package to use Python Script Advanced sensor is python.exe -m pip install. Please also see our Knowledge Base article for more information about Python installation: https://kb.paessler.com/en/topic/90686.
Download and install the Script
You’ll find the script Get-EnphaseData.py on Github.
If you’re unfamiliar with navigating GitHub, I screen-grabbed the process in my previous post, Get-EnphaseProduction.py.
The script file needs to be on your PRTG server in the folder “C:\Program Files (x86)\PRTG Network Monitor\Custom Sensors\python”.
Note that unlike our previous script, this one requires credentials to log into the Enphase Envoy controller. The username and password are added to the top of the script. The username is always “envoy”. The default password is the last six digits of the Envoy’s serial number, but you probably changed that to something more secure, didn’t you?
#Customise this with your own credentials:
username = 'envoy'
password = '12345'
Adding it to PRTG
This is exactly the same process as Get-EnphaseProduction.py. Just follow the steps here and report back when you’re done. I’ll wait.
Making it pretty
This is time-consuming but I think it’s worth it to make the graphs more useful.
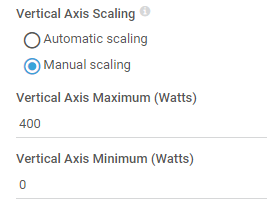
Firstly, I like to set the maximum and minimum to suit our system. Click on each of the panels to edit the channel and scroll down to Vertical Axis Scaling at the bottom. Set Manual scaling and a minimum of zero and a suitable maximum for your system. We have 400 Watt panels, so that seemed like a reasonable maximum.
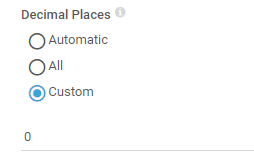
While you’re in there, set the Decimal Places to 0. We really don’t care about fractions of a Watt. It also keeps the averages in the tables neater.
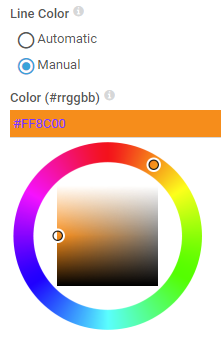
Our system has two banks of panels – one facing east to catch the morning sun and one facing north for the rest of the day. I identified all the east facing panels and set their Line colour to a lovely “sunrise orange”. All the north facing panels were set to a nice “midday blue”.
Click on OK and you’re done.
Rince and repeat. Rinse and repeat. Rinse and repeat with every panel, until you end up with this:
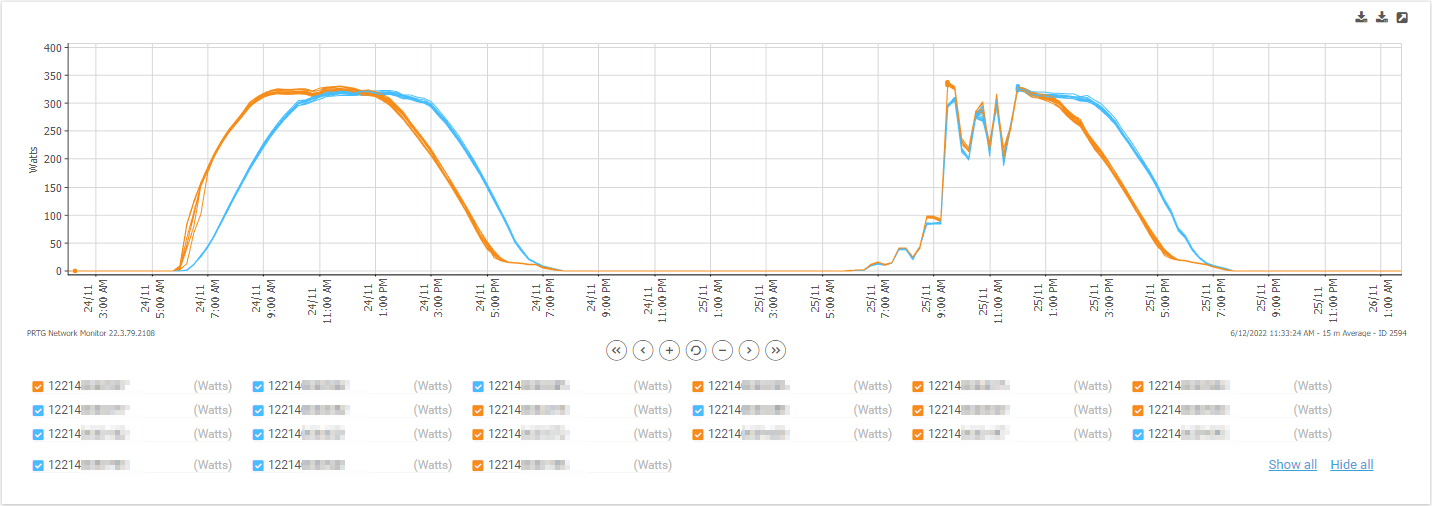
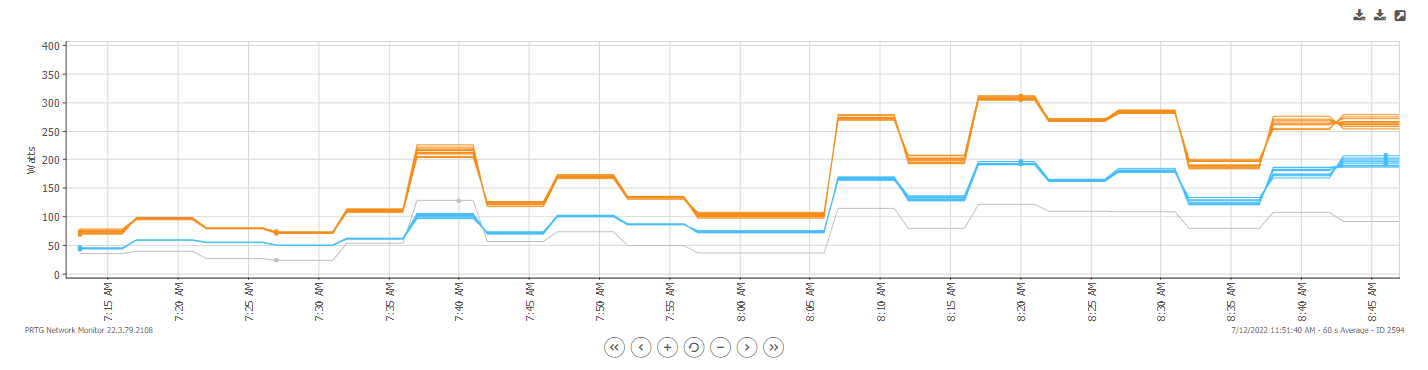
The end result is what looks like a two line graph, but is in reality a graph of every individual panel. It’s easy to see if any of the panels are straying from the norm. You can see from ours that we have a little bit of shading from a tree that brings some of the east panels on slightly later than others, but otherwise they are pretty well within a few Watts of each other.
Panel Range
One of the things we wanted to keep an eye on was if any panel’s output dropped. There could be many reasons for this ranging from seagulls to a faulty panel.
First of all I wanted to see what the normal range is, bearing in mind that we have two banks facing two different directions. You can see what the maximum panel range is on the Overview page, but I found it more useful to enable the Panel Range channel in graphs and eyeball what is “normal”.
Edit the “panel range” channel and set Graph Rendering to Show in graphs.

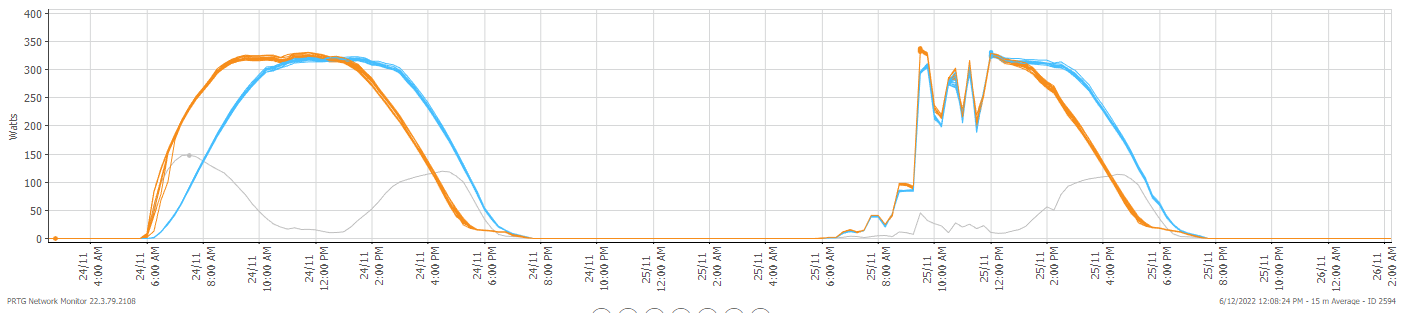
Once you have gathered a few days of data you will get an idea of what should be happening. The grey line in the graph below is the panel range. I decided that if the panel range went above 100 watts for more than 4 hours, there is probably something wrong. Your settings will depend on the configuration of your panels.
Now go into Notification Triggers and add a new Threshold Trigger using the numbers that you have determined.
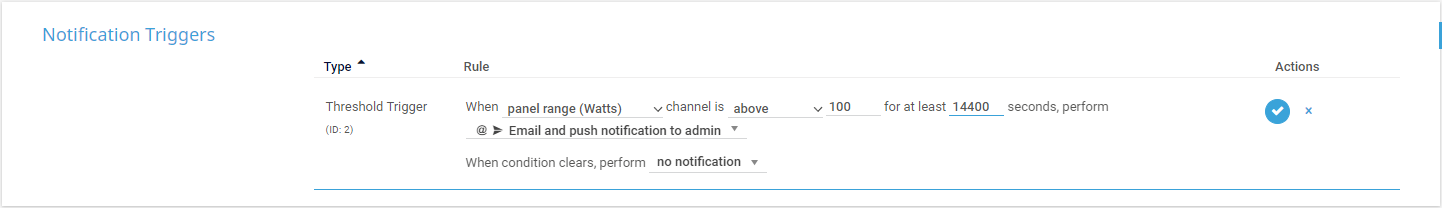
Now if any of the panels drop more than 100 watts below normal for more than 4 hours I will receive an email to let me know it’s time to get on the roof with a hose.
It’s paid off already!
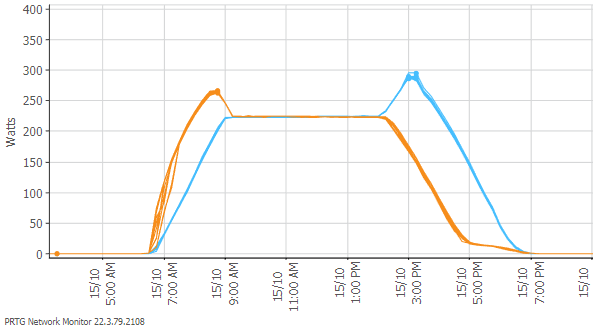
Our monitoring of the panels revealed an issue within days of the PowerWall’s installation. Inexplicably, the solar output was being limited or clamped.
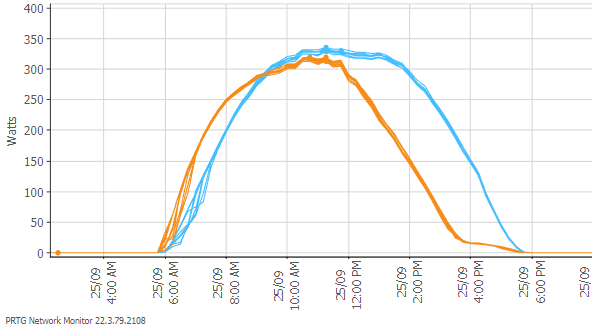
Here’s a comparison of sunny day generation, as reported by PRTG. Remember the orange and blue lines look blurry in the small image here for a reason: what you’re seeing are 11 blue and 11 orange lines showing the output of individual panels. They’re more distinct if you click on the image for a higher-resolution view.
Healthy |
Faulty |
 |
 |
Here’s an example of an affected day’s generation (in blue) and consumption (in orange) as reported by the Enphase “Enlighten” app:
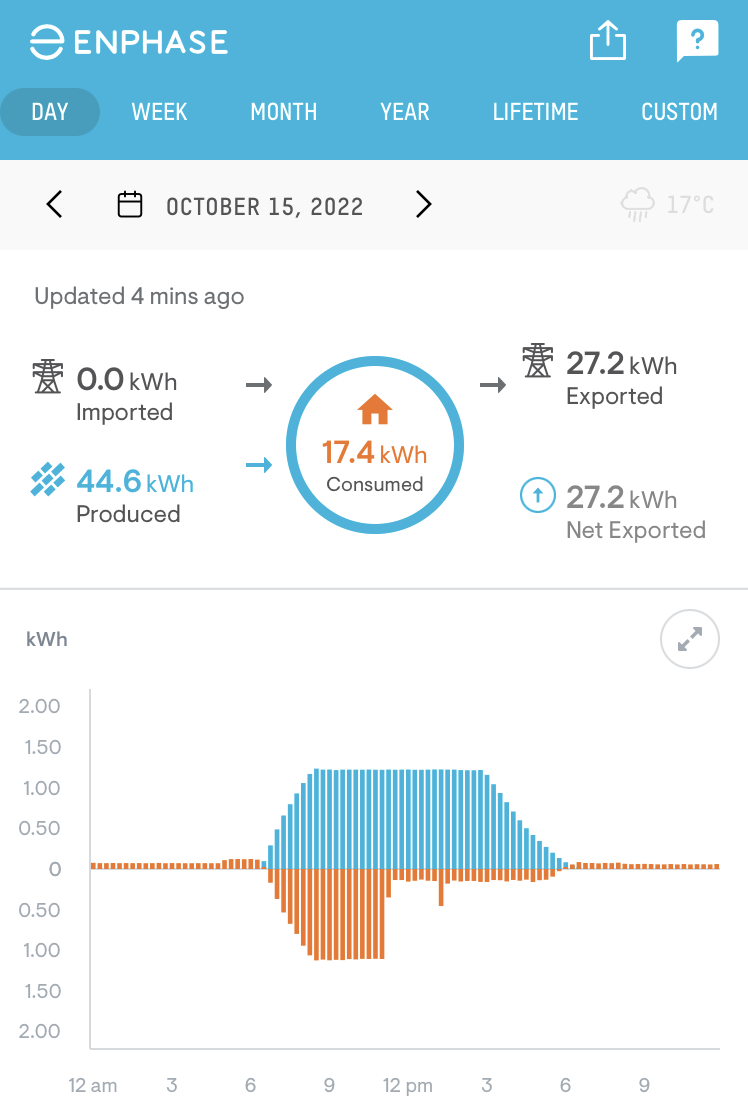
That flat-top “haircut” is definitely not right!
The issue was ultimately resolved remotely by Enphase support, and they didn’t share the specifics.
References / Credits
- “thecomputerperson” – Enphase Envoy-S “Data Scraping”
- Paessler PRTG
- a list of all the PRTG posts on greiginsydney.com
Thanks to Rocky for the PRTG content here. Our in-house demarcation means Greig writes the scripts and Rocky runs PRTG.
Revision History
26th July 2023. Fixed broken link.
25th July 2023. Updated to add references to the v7 version.
9th December 2022. This is the initial publication.
– G.


