Our new home has provided the opportunity to add a lot of “tech toys” to an otherwise blank canvas, and the most expensive by far has been the combination of solar panels, Enphase micro-inverters and Tesla PowerWall2 battery.
Solar + Battery
Here’s a very high level drawing of the setup, with thanks to Finn at SolarQuotes.com.au for the image.

We have two arrays, with 11 x 400W panels facing East and another 11 facing North, to a total of 8.8kW production.
Unlike a traditional solar panel setup where multiple panels are wired in series in “strings”, then the combined output sent to an inverter, EACH of our panels has its own dedicated inverter. This is usually a more expensive option, and one of the more obvious benefits is that if a single inverter fails you’re only down “1/n”% production until it can be replaced.
Whilst the house is fed by a 3-phase supply, the only load currently requiring all three phases is the ducted air-conditioning. The downside is that should we have a total power failure, we won’t be able to run the aircon off the battery, which we’ve decided is an unnecessary luxury we can forgo under the circumstances.
Let’s add some monitoring
Now “if a bear falls in the forest …” and there’s no-one there to hear it, did it really fall?
Naturally, we’re going to be monitoring the hell out of this solar setup, and that starts with the first of two Enphase scripts, which generate data for our Paessler PRTG reporting package:
- Get-EnphaseProduction.py – this post. Queries the installation for an overview of production and consumption.
- Get-EnphaseData.py. Queries the generation data for all of the invidual panels/micro-inverters.
- Get-EnphaseProduction-v7.py – the v7 version of this post. You’ll need this when your firmware is updated.
- Get-EnphaseData-v7.py – the v7 version of this post. You’ll need this when your firmware is updated.
A caveat / word of warning
Enphase controls the firmware in your Envoy, and there seems to be quite a variety of versions in the wild. We’re on D5.0.62, and I know in some other countries they’re on v7.
I’ve seen reports that Enphase has possibly locked us out of local reporting of the Envoy in v7, so this script might not work for you. I’ll update this post with a note should our eventual upgrade to v7 break anything. It’s happened. The new script is here.

To determine your own Envoy version, login to the Enlighten website, click the hamburger then System / Devices / Gateway.
Pre-Requisites
- You need to know the IP address or hostname of your Enphase “Envoy” unit.
- PRTG needs the “requests” module installed. If it’s not installed you’ll need to know the password for the default Windows Administrator account to install it.
- PRTG needs to be running on a release later than 22.2.77.2204:
PRTG Version 22.2.77.2204 broke compatibility with pip.exe install (to install Python packages). With this PRTG release we have removed support for this command to prevent unexpected errors. As of now the only supported way of installing a Python package to use Python Script Advanced sensor is python.exe -m pip install. Please also see our Knowledge Base article for more information about Python installation: https://kb.paessler.com/en/topic/90686.
Features
There’s a wealth of information that can be gleaned from the built-in Enphase web API. Type http://<envoy_ip>/production.json into your web browser and see for yourself. This will also test if the script will work for your system or if your Enphase version has dropped this feature.
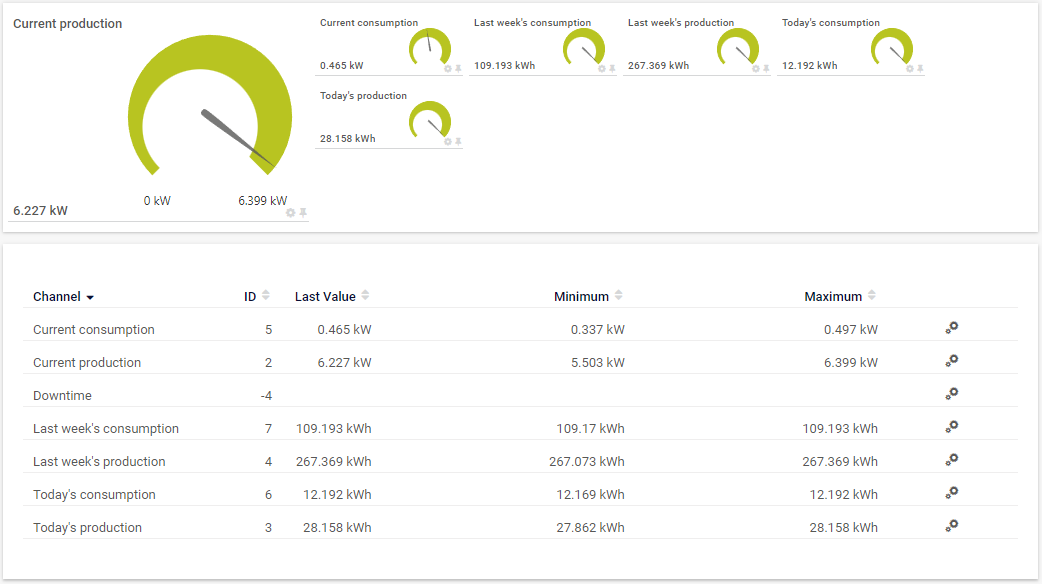
The data that we’re interested in is current solar production and consumption as well as production and consumption for the day so far and the past 7 days.
The script will extract this data from the JSON and bring it into PRTG. Out of the box, current production and consumption is graphed while everything is written to tables for historical data.
Potentially, I think we could also pull battery data, but that assumes you are using an Enphase battery system, which obviously we aren’t. If you do have the Enphase battery, you might like to contribute to the script and add the fields in.
Download and install the Script
You’ll find the script Get-EnphaseProduction.py on Github.
The two easiest ways to copy it to your PC are:
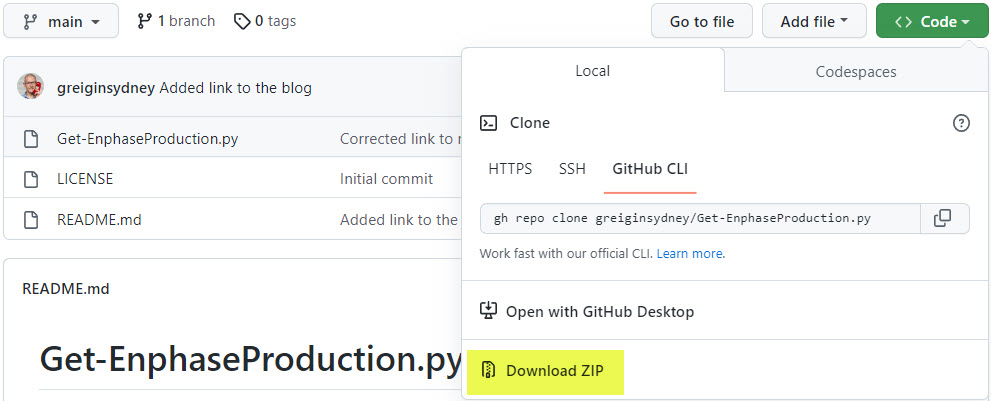
Download the zip
From the main page of the repository, click the green “<> Code” button, then click “Download ZIP”:
Unzip the archive and move or copy the script file to your PRTG server, placing it in the folder “C:\Program Files (x86)\PRTG Network Monitor\Custom Sensors\python\”.
Scrape the RAW text
From the main page of the repository, click the name of the script file:
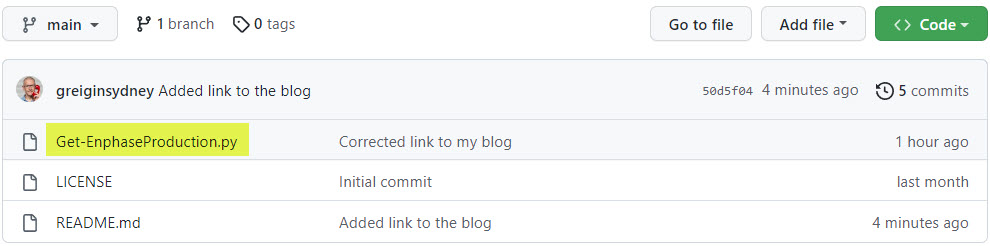
Now in the header, click the pulldown next to the copy icon and select Copy:
![]()
Now paste the contents of your clipboard into a new text file called “Get-EnphaseProduction.py” in “C:\Program Files (x86)\PRTG Network Monitor\Custom Sensors\python\”.
Adding it to PRTG
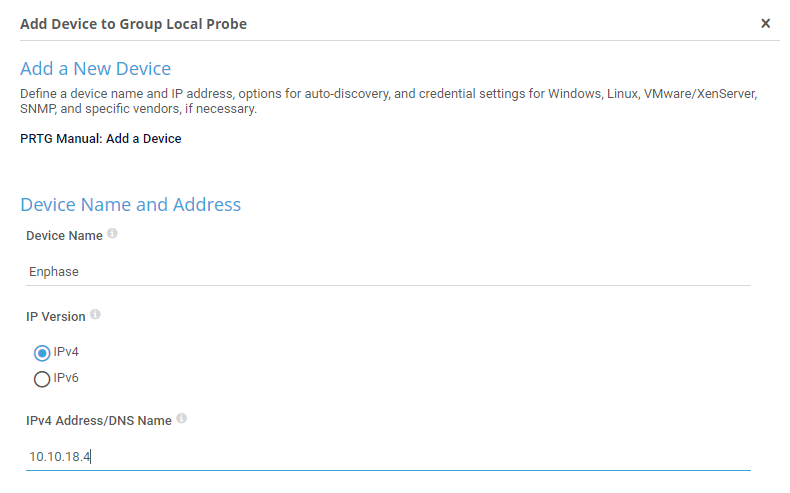
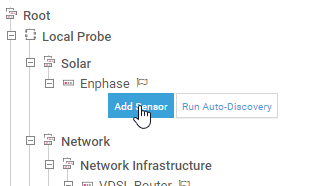
In the PRTG console, right-click on the group of your choice to add a new device. I’ve created a new group called “Solar” and added it there. Then all you need is a suitable name for the device and its IP address or host name.
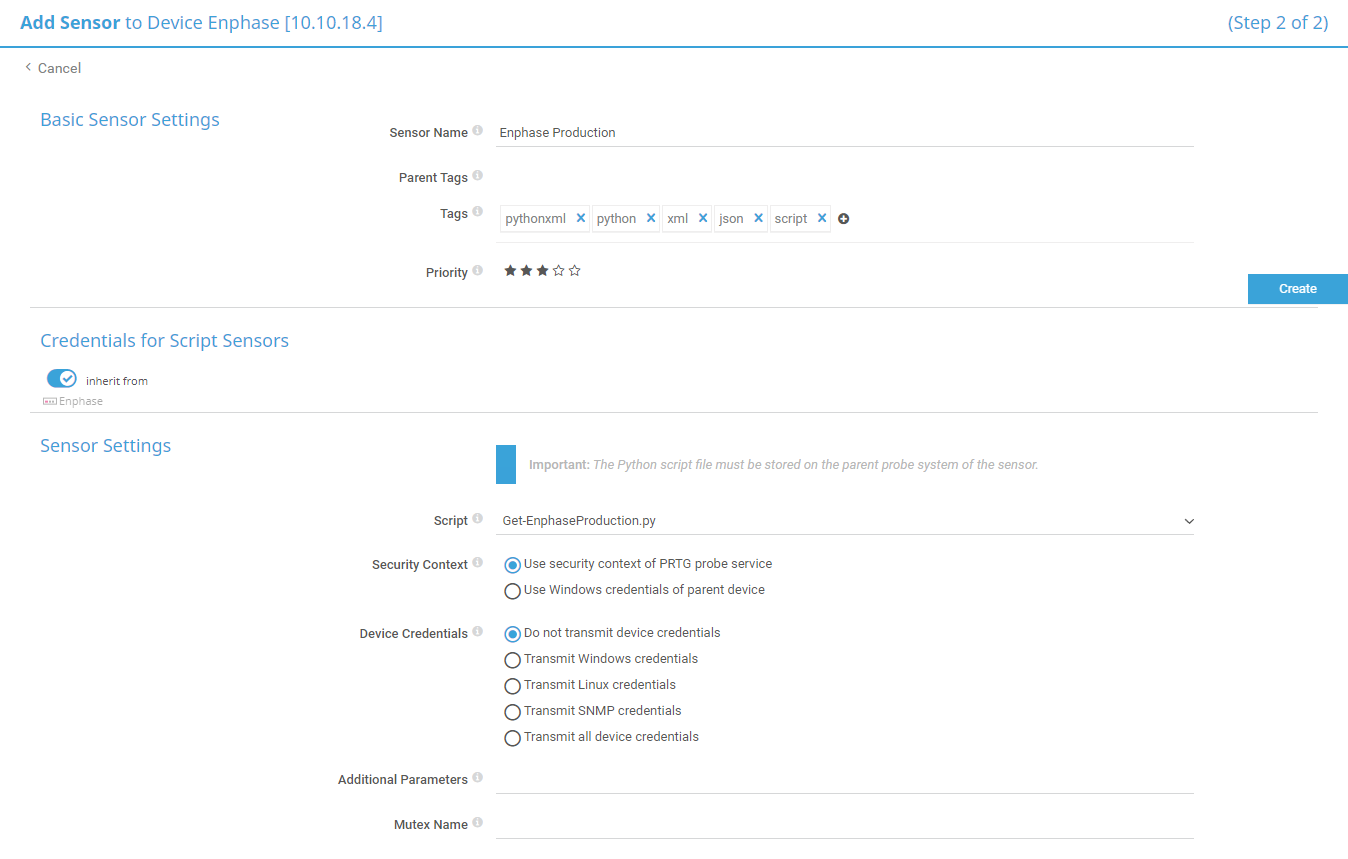
Now we can add the Python sensor to your new device. Click on Add Sensor and search for “python”. There is probably only one option – the “Python Script Advanced” sensor. Select that one.
Just add a sensor name and select the Get-EnphaseProduction.py script from the dropdown. Click Create and you are ready to go.
In about a minute you should start seeing the data coming in.
Making it pretty
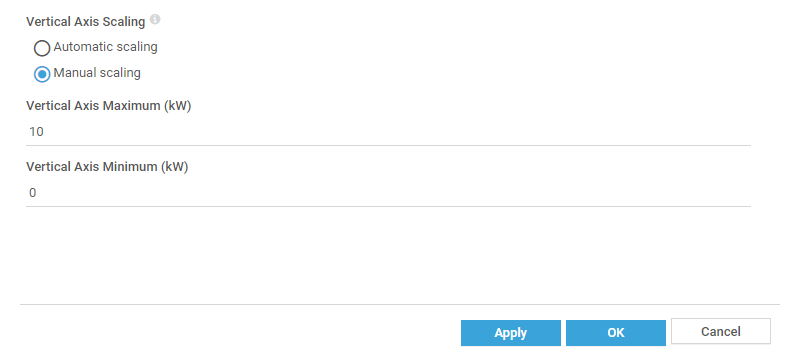
This is not entirely necessary, but I like to set the graph’s minimum and maximum to suit our solar system.
Click on Current consumption to edit the channel and scroll down to the Vertical Axis Scaling at the bottom. Set Manual scaling and a minimum of zero and a suitable maximum for your system. We have an 8.8kW system, so I went for 10 as a nice round figure for a maximum.
While you’re in there, it’s worthwhile setting the Decimal Places to 3. That way the averages in the tables don’t end up spanning over ten digits.

Click on OK and you’re done.
Do the same for Current production.
Now you should have a nice neat graph of your electricity production and consumption.
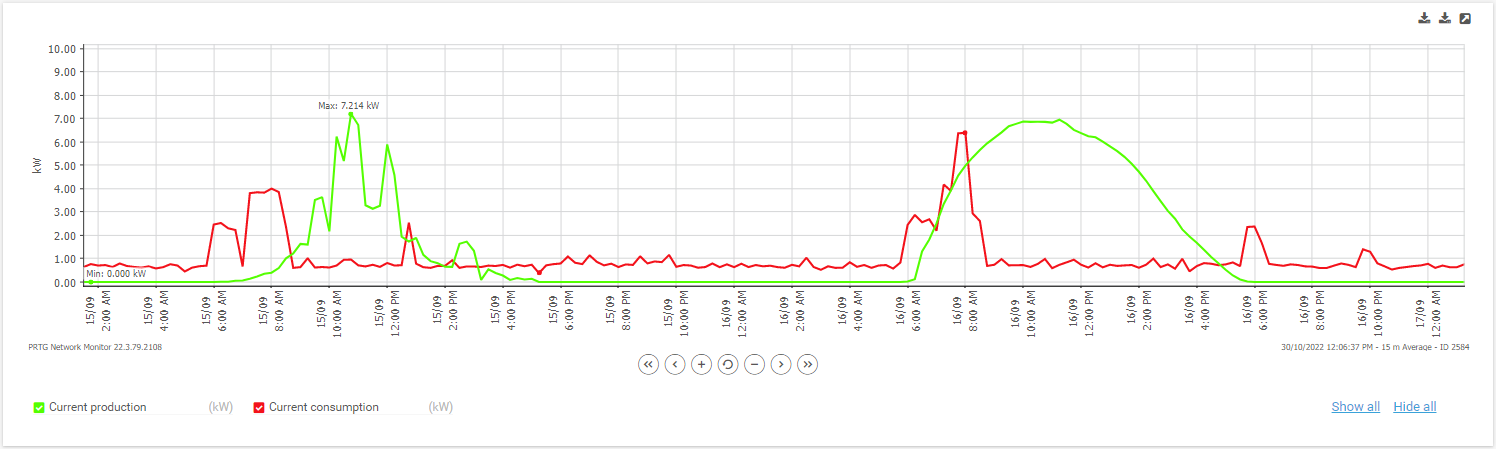
The only other minor change I made was to set the colours for production and consumption. Green is good and red is bad, right?
Now we can see just how we’re tracking with our production and consumption. You can see from the graph above that the 15th was a pretty cloudy day while the 16th was a beautiful sunny day, producing lots of power. You can also see that we get out of bed at 6am, turn on the heater and “Mr Coffee”.
Now we have another tool to micromanage our power consumption, running around turning off every available appliance when the solar output drops and shifting power hungry tasks to peak output times. Apparently this is normal behaviour for new owners of solar systems. Hopefully we’ll settle down once the novelty wears off.
References / Credits
- “thecomputerperson” – Enphase Envoy-S “Data Scraping”
- Paessler PRTG
- a list of all the PRTG posts on greiginsydney.com
Thanks to Rocky for the PRTG content here. Our in-house demarcation means Greig writes the scripts and Rocky runs PRTG.
Revision History
26th July 2023. Updated to add references to the v7 version.
5th November 2022. This is the initial publication.
– G.


