
We’ve had a Davis Instruments Vantage Vue weather station on the roof for some time now, and with the addition of the “WeatherLinkIP datalogger” its data is uploaded to the greater Davis WeatherLink platform automatically.
Their service is subscription-based, and we’ve not seen sufficient value in giving them ~AUD5/month to have access to the historical data, so we’re stuck on the quasi “real-time only” free tier.
We happen to use the free version of Paessler’s PRTG Network Monitor to monitor all we have here, and it recently occurred to Rocky to see if we could capture the weather station’s data as well. Turns out that’s a YES.
“Get-WeatherLinkData.ps1”
Features
- It reports in Imperial measurements by default. Add the ‘-metric’ switch for km/h and ℃
- The output format defaults to PRTG. Add the ‘-OutputFormat’ switch followed by either ‘csv’ or ‘object’ for those formats instead
- Want to see the output saved to a file? Add the ‘-Filename’ switch followed by a filename
- Just in case the network connection to the weather station is a bit iffy, it makes 5 attempts per run of the script to get a good read. Run the script with a ‘-retries <n>’ value to set a different value
- The output data from the weather station has a CRC value. The script tests this and only reports success=true if it decodes correctly.
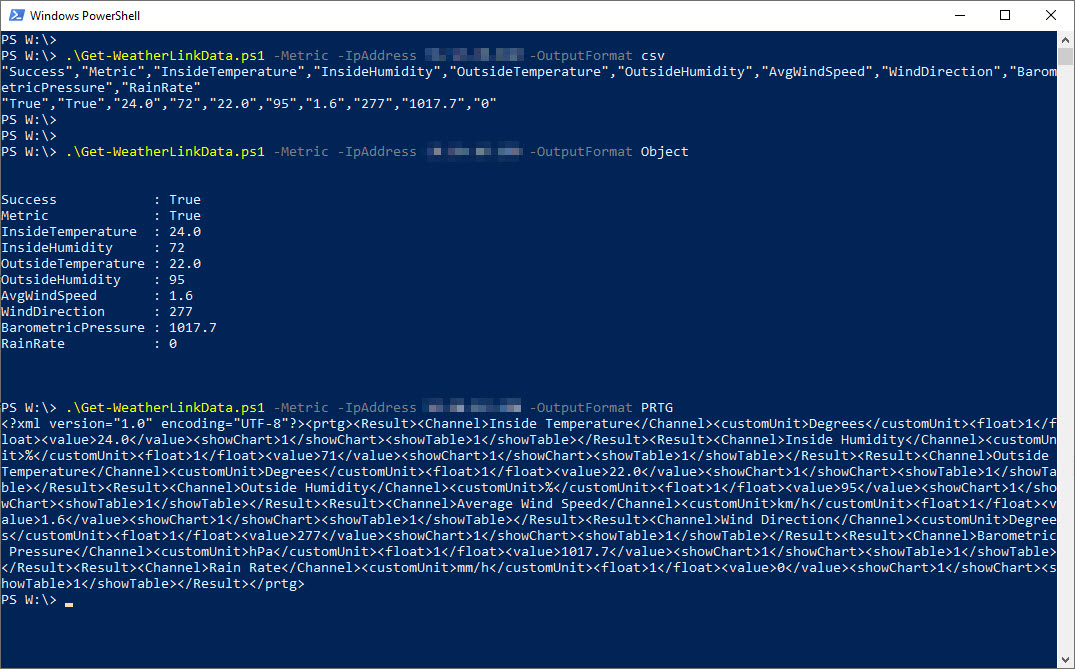
Here’s what it looks like on screen. This image shows 3 runs with the different output formats.
Add it to PRTG
First, download the script and copy it to the Custom Sensors directory on your PRTG Server. (C:\Program Files (x86)\PRTG Network Monitor\Custom Sensors\EXEXML) The Github link to the script is at the bottom of this page.
Then in the PRTG Web Interface, right-click where you want to add the Weather Station and select “Add Device”. You only need to fill in the “Device Name” and “IPv4 Address/DNS Name” of your weather station.

Now add a sensor to your new device. The sensor type is “EXE/Script Advanced”.
Give your sensor a name and select the script from the EXE/Script dropdown.
In the Parameters field, add whatever parameters are relevant for your environment. At the very least, you will need the IP address for your weather station. Most of the civilised world will also need to add the -Metric parameter.
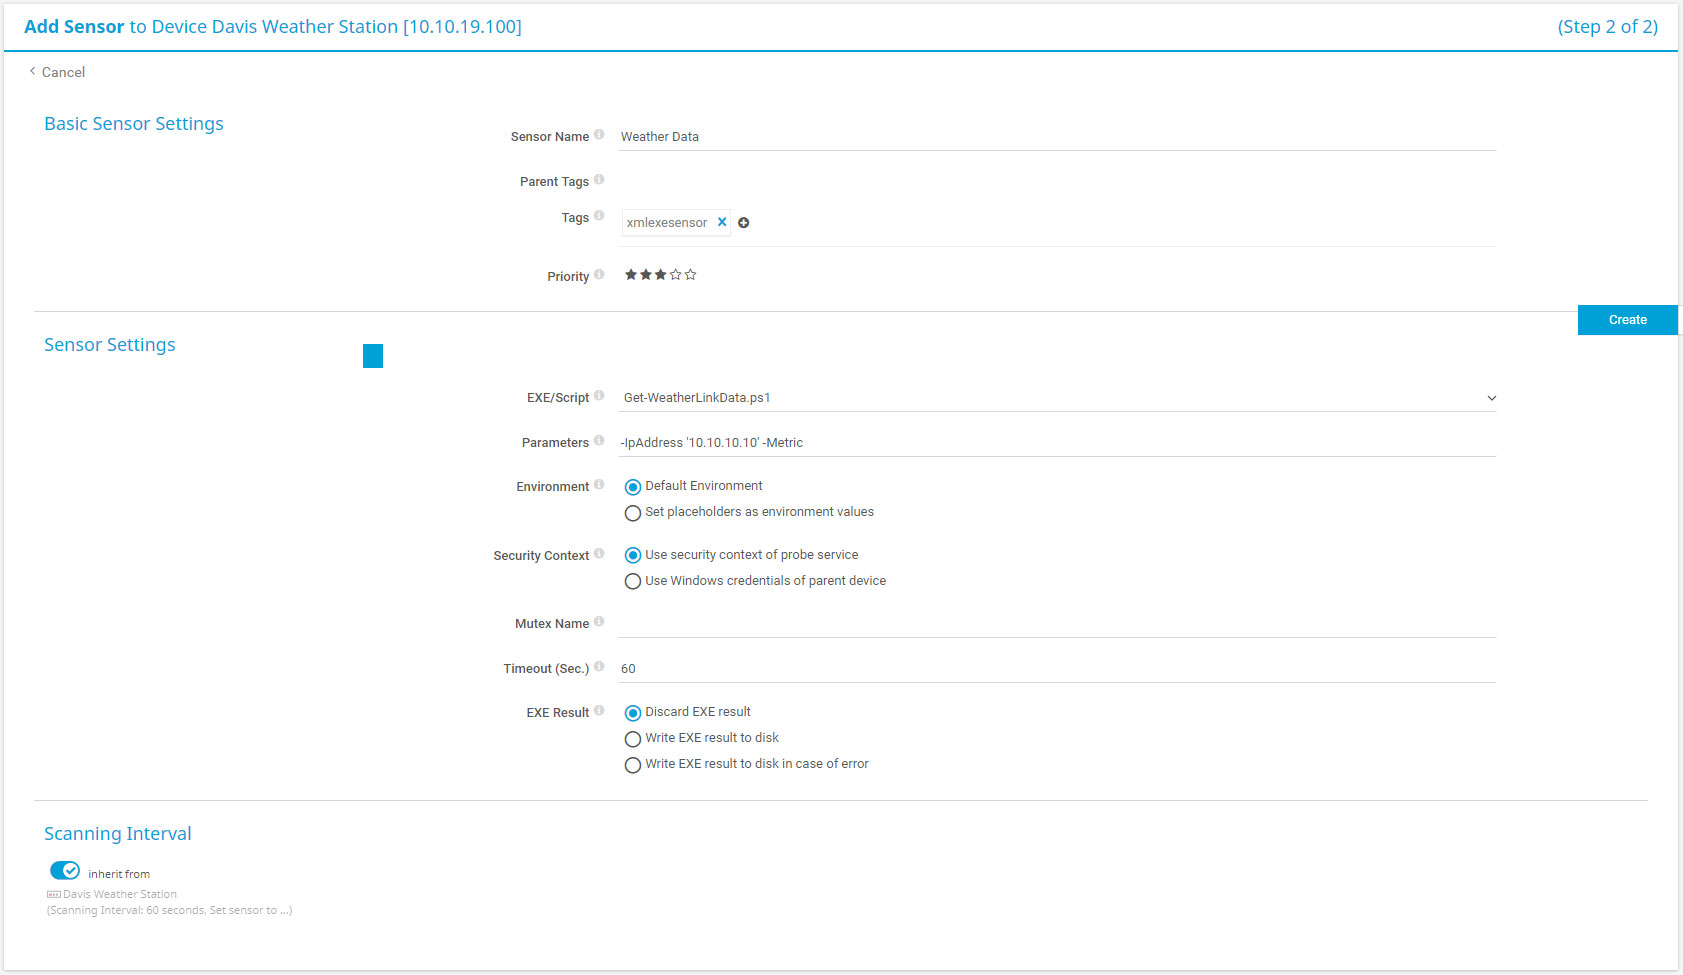
You can leave all the other settings as they are and click “Create”.
It will take a minute before the script fires and collects its first set of data.
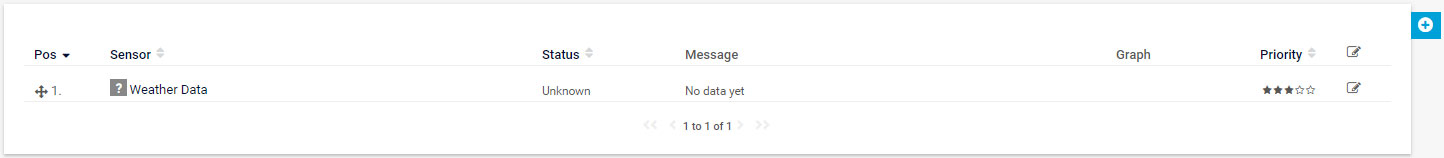
The Question Mark Icon will turn to a green tick once it has some data.
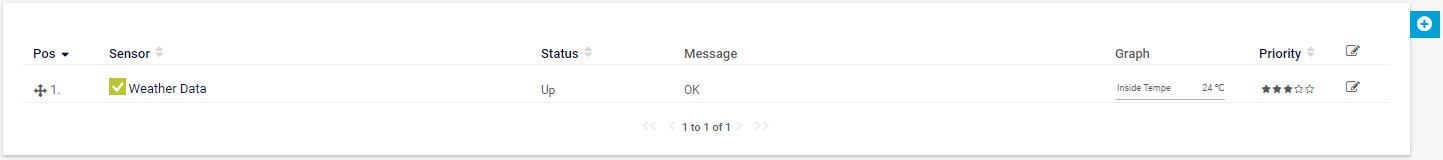
Now you can click on your new sensor and view your data.

Making it pretty
The system is now fully functional, but looking at the chart the weather is looking a little bit wild, with Armageddon striking at about 1pm. In reality, the weather was actually very stable. Auto scaling is making the graph is a bit misleading. I made a few changes within PRTG in order to stop the graphs auto-scaling and make them a little easier to interpret.
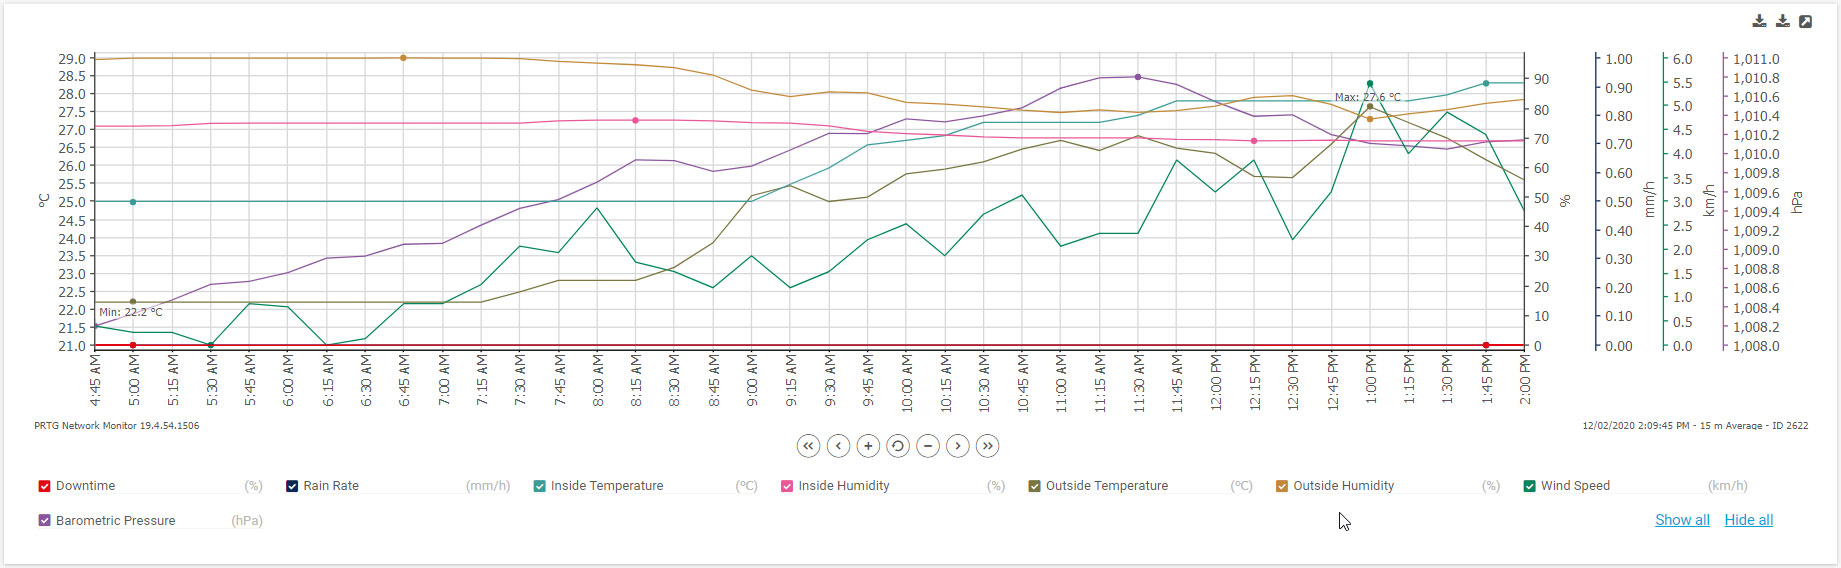
On the “Sensor Overview” page, click on each of the channels in turn to edit the channel settings. The settings we are after are at the bottom of this screen. We will change “Decimal Places” and “Vertical Axis Scaling”.
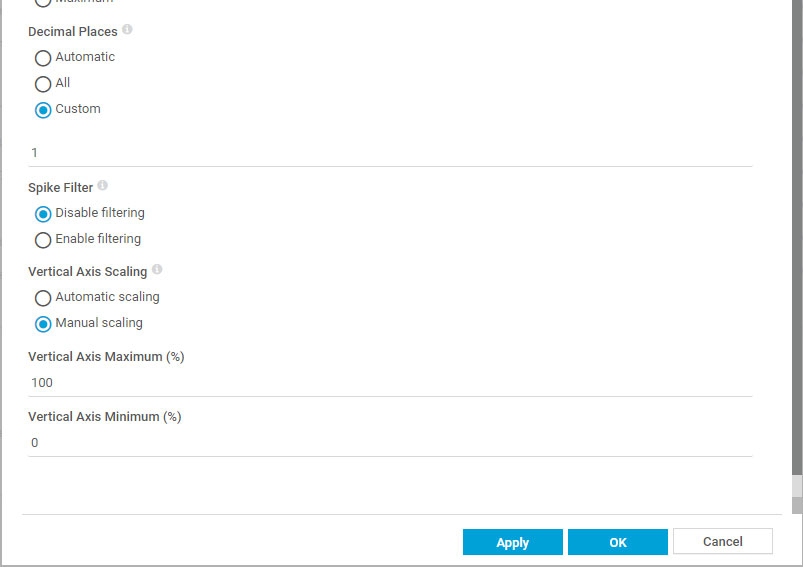
These are the numbers that I came up with that seem to work here in Sydney. Of course, the best numbers to use may differ, depending on your climate. Consider these a starting point.
| Metric | Imperial | |||||
|---|---|---|---|---|---|---|
| Decimal | Vert Min | Vert Max | Decimal | Vert Min | Vert Max | |
| Temperature | 1 | 0°C | 50°C | 1 | 20°F | 120°F |
| Humidity | 0 | 0% | 100% | 0 | 0% | 100% |
| Wind | 0 | 0 km/h | 100 km/h | 0 | 0 mph | 60 mph |
| Barometer | 2 | 1000 hPa | 1030 hPa | 3 | 29 inches Hg | 30 inches Hg |
| Rain | 1 | 0 mm/h | 100 mm/h | 2 | 0 inches/h | 4 inches/h |
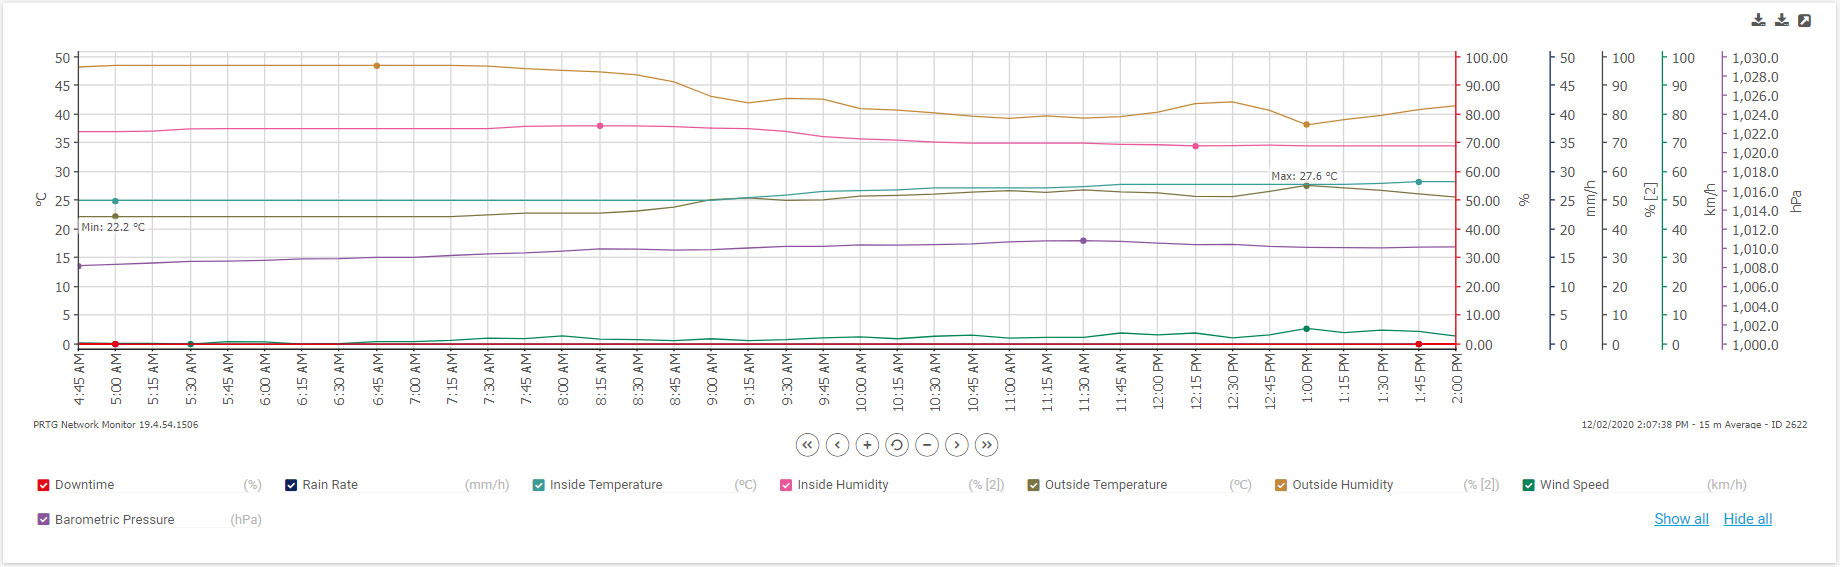
You should now end up with a relatively neat chart tracking your weather conditions. Now when the wild weather hits, you will definitely know about it.
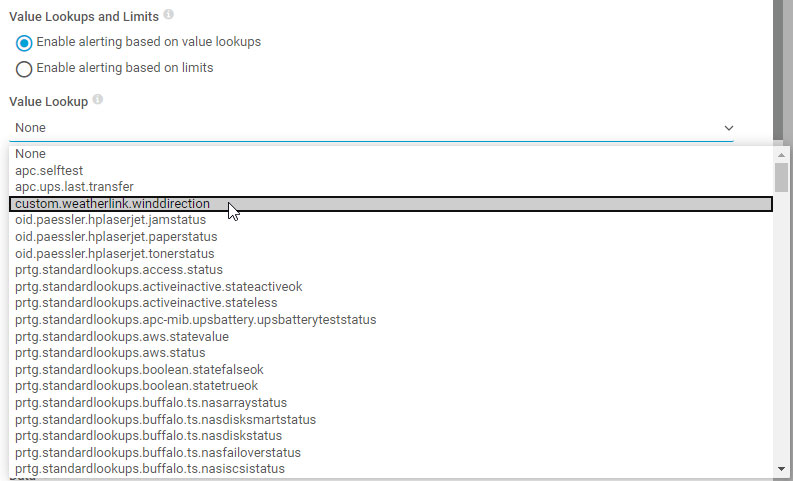
Add Wind Direction Lookup
In a freakish coincidence, Simon Bell was writing his own script to extract the data from his Davis Weather Station into PRTG, using a third party datalogger and a REST API. He came up with the idea of using PRTG’s lookup feature to convert the wind direction from the numerical value in degrees to more human-readable compass points. (North, South, South-East, etc.)
I thought, I could steal that idea.
Based on Simon’s post, I’ve created a lookup file (weatherlink.winddirection.ovl) and added it to the Github Repository at the bottom of this post. Download and copy it to the Custom Lookup folder on your PRTG Server. (c:\Program Files (x86)\PRTG Network Monitor\lookups\custom\)
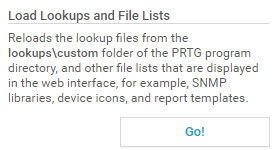
Before you can use any new lookup files, they must be loaded by PRTG. To do this, go to Setup > Administrative Tools and click on the Go button to “Load Lookups and File Lists”.
Now go back to your Weather Station Device and click on the Wind Direction line on the overview page.
All you need to do is use the drop list to select custom.weatherlink.winddirection as the Value Lookup and click on OK.
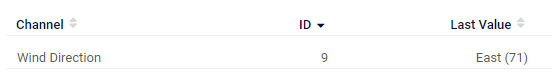
Now the wind direction will be reported as the points on the compass followed by the actual reading in degrees.
References
Download
The script lives at GitHub: https://github.com/greiginsydney/Get-WeatherLinkData
Revision History
12th February 2020: this is the initial release.
23rd February 2020: added Wind Direction Lookup.
– G & R.


Great to see an unusual use case for PRTG. Love the idea of using manual scaling to smooth out the returned values. Nice job guys.