In my post “Get-WeatherLinkData.ps1” I mentioned we use the free version of Paessler’s PRTG Network Monitor to monitor all we have here. It’s a great little monitoring platform, and we use it to not only keep an eye on the servers and various web-pages we run, but also track and trend our weather.
After suffering poor service from a previous ISP a few years ago, we started running a script utilising H.Merijn Brand’s Perl Speedtest CLI on our PRTG server to keep a track of speeds. It did the job but meant that Perl needed to be installed on the server.
It thus caught our eye when we saw recently that the world standard “speedtest.net” by Ookla has spawned an API.
And thus, New-OoklaSpeedTest.ps1 was born.
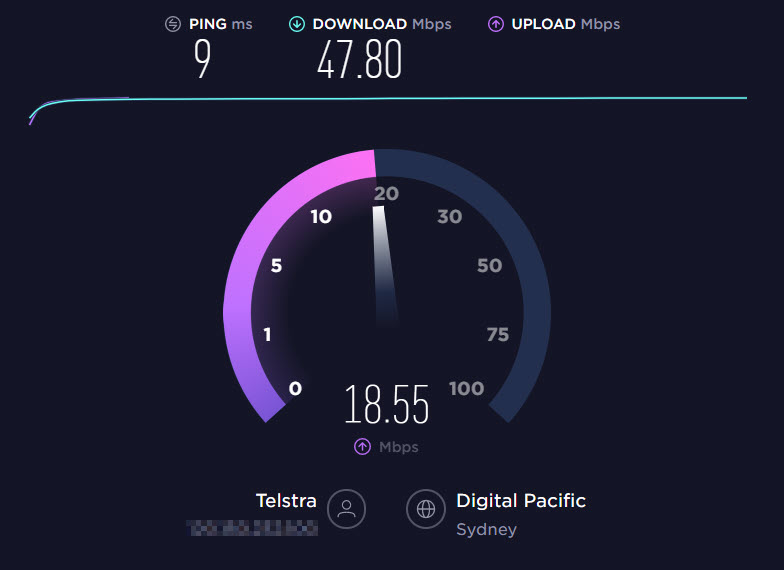
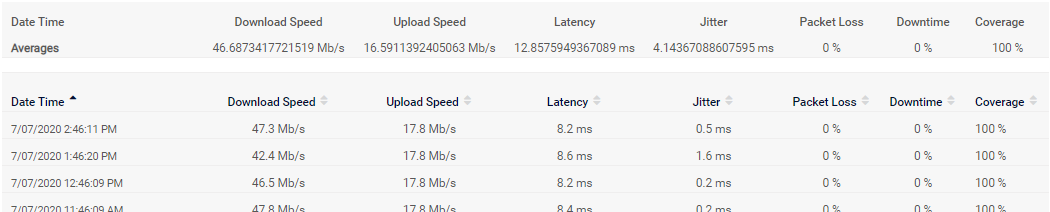
This script runs on a schedule under PRTG, captures the results of the speed test and feeds all the useful metrics into PRTG. Now we have a reliable, trustworthy report of upload and download speeds, jitter, latency and packet loss.
The API will let you specify the server to query, or you can let it decide. The server that you tested against is output by Ookla, but as PTRG won’t capture text fields, we can’t surface it in the reports.
Run with no switches, the script will display the output on screen. Add a “-filename” value and it will save the output to that file/location, overwriting any previous file of the same name.
If you have an unreliable connection, “-retries” (a value from 0 to 4) lets you make multiple attempts before reporting a failed test to PRTG.
Adding “-precision” and a number from 0-8 will report the results to that number of decimal places. (At the time of writing, the Speedtest API *also* accepts a precision value, but it doesn’t work well, reporting some badly rounded numbers like latency of 8.2870000000000008 when 3-digit precision was requested – so I’ve done the rounding in the script.)
The optional ‘-debug’ switch will save a lot more information into a monthly log file, in the format “New-OoklaSpeedTest-yyyyMMM.log”, with each entry prefaced by a timestamp:
Jul11-2230 Launched
Jul11-2230 Output file is     "W:\SCRIPTS\New-OoklaSpeedTest.ps1\test.xml"
Jul11-2230 Speedtest found at "W:\SCRIPTS\New-OoklaSpeedTest.ps1\Speedtest.exe"
Jul11-2230 Params   = "--format=json --accept-license 2>&1)"
Jul11-2231 Response = {"type":"result","timestamp":"2020-07-11T12:31:21Z","ping":{"jitter":0.53700000000000003,"latency":9.0299999999999994},"download":{"bandwidth":5980994,"bytes":38826919,"elapsed":6504},"upload":{"bandwidth":2386128,"bytes":21848868,"elapsed":9304},"packetLoss":0,"isp":"Telstra Internet","interface":{"internalIp":"10.10.17.77","name":"","macAddr":"B4:2E:99:44:35:61","isVpn":false,"externalIp":"xxx.yyy.zzz.aaa"},"server":{"id":5744,"name":"Digital Pacific","location":"Sydney","country":"Australia","host":"speedtest.mirror.digitalpacific.com.au","port":8080,"ip":"101.0.120.90"},"result":{"id":"4d9ba3fc-6f1c-4f89-bd7a-1b4644fbdd80","url":"https://www.speedtest.net/result/c/4d9ba3fc-6f1c-4f89-bd7a-1b4644fbdd80"}}
Jul11-2231 InternalIp   : 10.10.17.77
Jul11-2231 IsVpn        : False
Jul11-2231 ExternalIp   : xxx.yyy.zzz.aaa
Jul11-2231 ISP          : Telstra Internet
Jul11-2231 ID           : 5744
Jul11-2231 Name         : Digital Pacific
Jul11-2231 Location     : Sydney
Jul11-2231 Country      : Australia
Jul11-2231 Host         : speedtest.mirror.digitalpacific.com.au
Jul11-2231 IP           : 101.0.120.90
Jul11-2231 Download b/w : 5980994
Jul11-2231 Upload b/w   : 2386128
Jul11-2231 Jitter       : 0.53700000000000003
Jul11-2231 Latency      : 9.0299999999999994
Jul11-2231 Packet loss  : 0
Jul11-2231 Exited cleanly.
Add it to PRTG
Download Speedtest from Ookla and the script from Github and place them in the Custom Sensors directory on your PRTG Server (C:\Program Files (x86)\PRTG Network Monitor\Custom Sensors\EXEXML). Links are at the bottom of this page.
In the PRTG console we will now create the sensor. It doesn’t really matter what device it’s attached to – you could just put it on the Probe Device. I’m going to put mine on the Internet device, which PRTG creates by default.
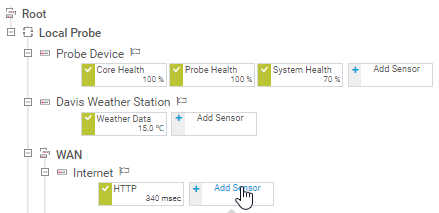
Click on Add Sensor and select the “EXE/Script Advanced” sensor type. Give your sensor a name and select the script from the EXE/Script dropdown.
You don’t need to add any extra parameters unless you need to enable debug or want to force a particular Speedtest server, but you will probably want to change the Scanning Interval to something greater than the default 60 seconds. I’ve chosen to run it once an hour.
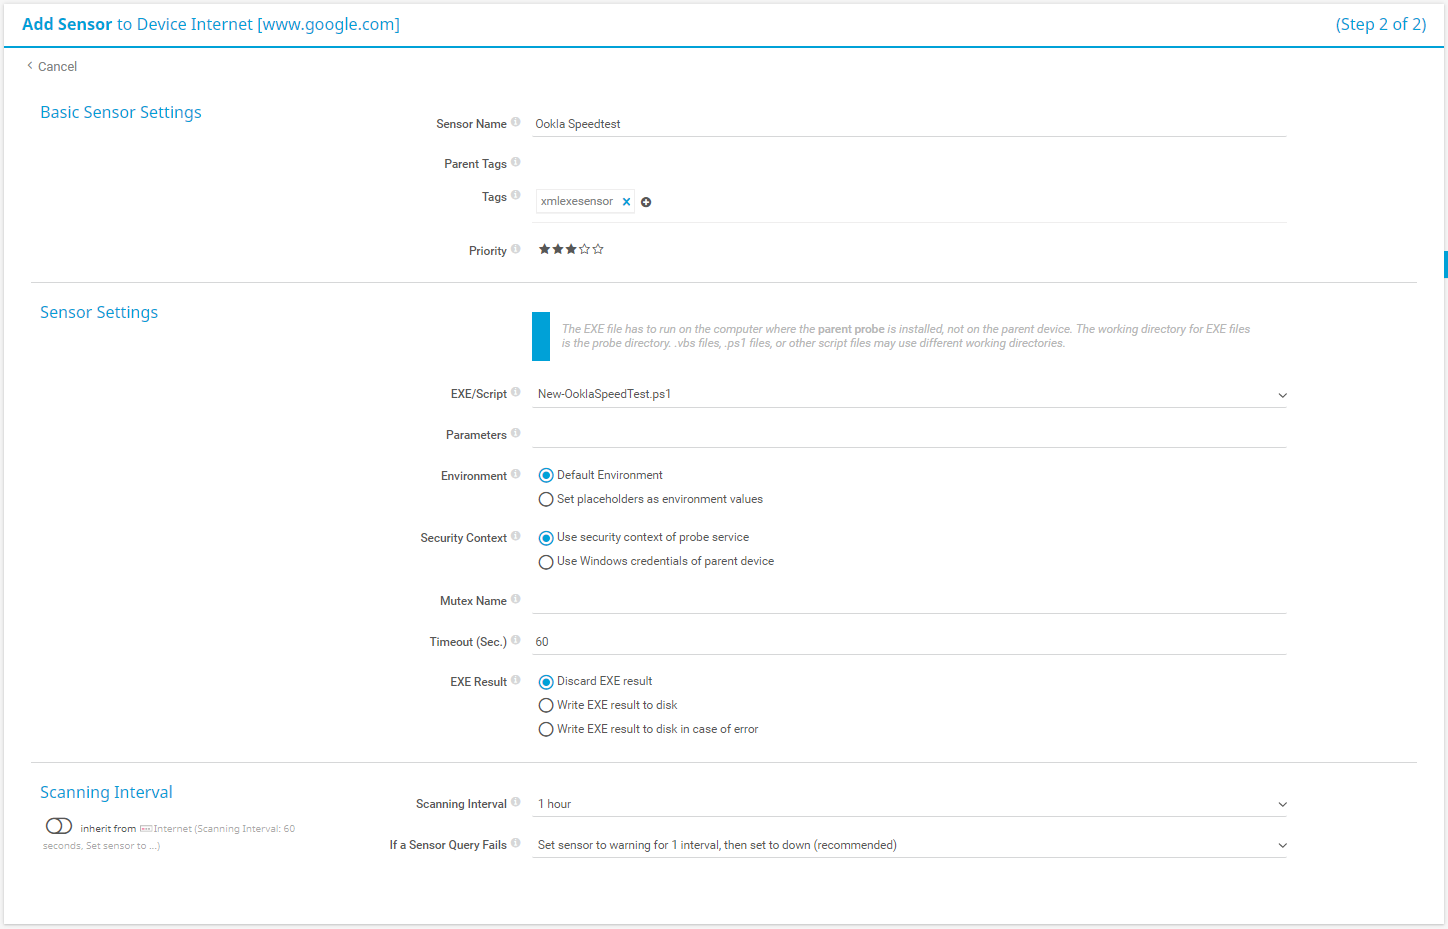
Click “Create” and you are done.
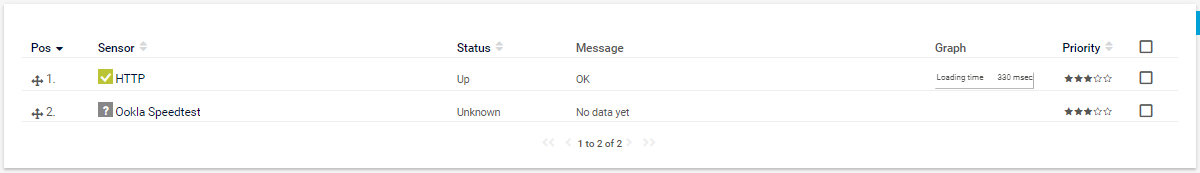
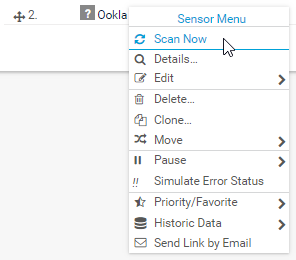
If you’ve set a long scanning interval it will probably take a few minutes before the script fires and collect its first set of data. Once it has, the grey question mark will turn into a green tick. If you’re the impatient type like me, you can right-click on the sensor and select Scan Now.
It should only take a minute to refresh and show the green tick.
You can now view your data.

GDPR
If you’re in the Euro-zone, you’ll need to consent to GDPR, and for that I’ve added another switch.
You’ll need to edit the sensor to add this, as shown here:
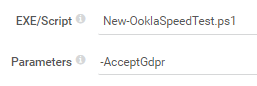
(I’ve captured the relevant terms and conditions from Ookla in the script’s header, if you’re feeling so inclined.)
Making it pretty
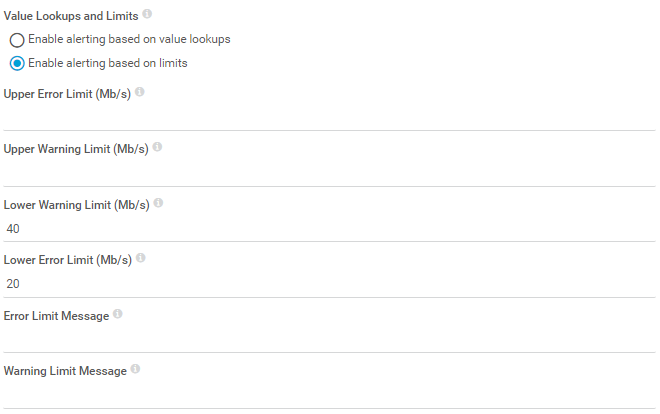
There’s not a lot really here that needs to change. Click on each of the channels in the Overview page and consider setting upper warning and error limits on latency, jitter and packet loss and lower warning, and error limits on upload and download speed.
Here I have set a warning if the download speed drops below 40Mb/s and an error if it drops below 20Mb/s. The later will trigger an email to prompt me to give our ISP a kick.
Scrolling down the “Edit Channel” screen, you might like to change the number of decimal places from “All” to a more manageable number. While you can set the number of decimal places in the script, if you don’t limit it in here, the averages at the top of the column end up with a lot of useless digits.
I’ll change all mine to 2 except for Packet loss. That can stay at 0.

Much neater.

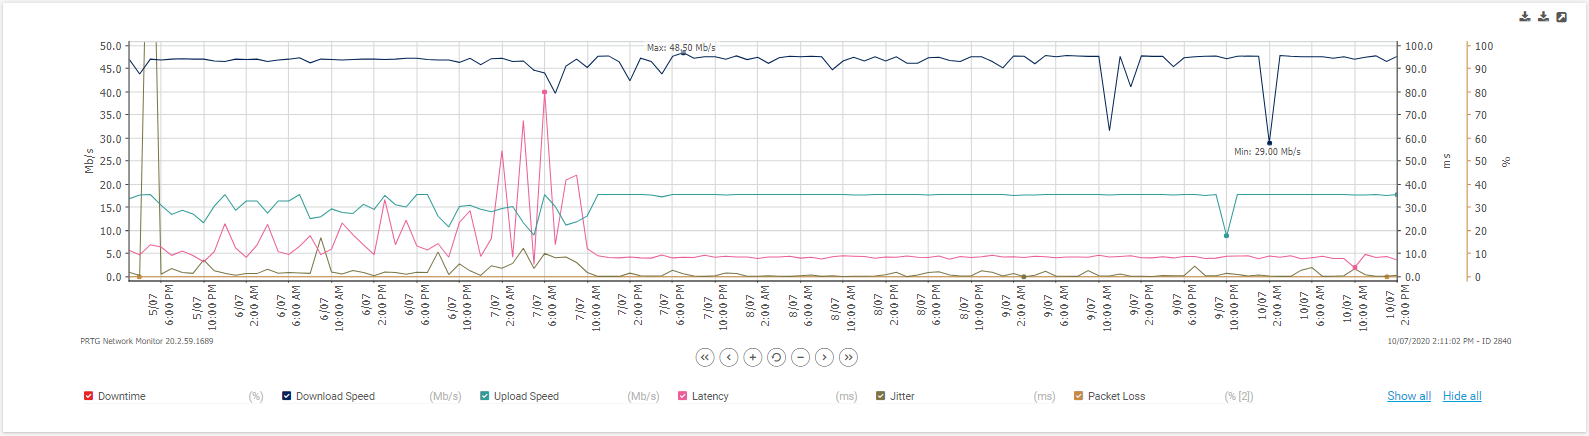
Finally, scroll right down to the bottom and change the vertical axis scaling from automatic to manual.
Given that we are blessed with a 50Mb/s data service here, 50 seems like the obvious maximum for the bandwidth measurements. Hopefully setting the minimum at 0 turns out to be greatly pessimistic.

For latency and jitter, I set the maximum at 100ms and minimum 0. That should catch most peaks.
It doesn’t matter if you later change your mind on any of these settings – they only affect the rendering of the data. The data is intact so any changes made will be reflected immediately.
The end result is a nice easy to read graph of all the speedtest data. Any anomalies are obvious and if you do need to log a fault with your ISP, you have a complete history of your service.
Troubleshooting
If your speedtest sensor is throwing errors there are two ways you can peek under the hood to see what’s going wrong.
PRTG Logs
To start PRTG logging results, go back into the sensor settings and enable “Write EXE result to disk in case of error”. This will do exactly as it says on the box and create a log file of the output of the script in “C:\ProgramData\Paessler\PRTG Network Monitor\Logs\sensors”.
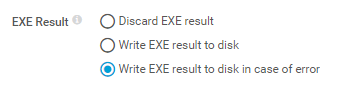
You might need to make a note of the sensor ID number from the main overview page if you are logging more than one sensor. Note that the log file is overwritten each time it runs.
New-OoklaSpeedTest Logs
We’ve also built logging into the script file itself. Once again, go into the sensor settings and simply add the -debug switch as a Parameter. This will create a logfile in the format “New-OoklaSpeedTest-yyyyMMM.log” in the same folder as the script itself.
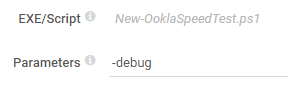
This log file is continuous, starting a new log every month. As well as displaying any errors it can be useful for identifying exactly which speedtest server is being used for each test as well as all the raw data from the test.
Pre-req’s
You need to have downloaded the SpeedTest API first. It’s a simple download and doesn’t require installation. You can download it from here.
Download
The script lives at GitHub: https://github.com/greiginsydney/New-OoklaSpeedTest.ps1.
Revision History
14th July 2020. Added the GDPR reference.
14th July 2020. Added troubleshooting section.
12th July 2020. This is the initial publication.
– G.


Hi Greig!
Very useful script! Have it deployed on my Internet probe and it’s working great! I was curious, if it would be possible for this script to work on a client desktop in a LAN probe?
I would like to have this script run on client machines in my LAN and cross reference their results with what is gathered from the Internet probe. I’m not too familiar with how custom sensors work and was curious if you had any insight here.
Thank you again for the great script!
You can install a PRTG Remote Probe on any machine and that machine will appear in PRTG. Then copy the script and speedtest.exe to that machine and add the sensor.
https://www.paessler.com/support/how-to/remote-probe-installation
Hi Greig,
I followed your documentation and I am getting the following error:
“XML: The returned XML does not match the expected schema. (code: PE233) — JSON: The returned JSON does not match the expected structure (Invalid JSON.). (code: PE231)”
Any help?
Thanks!
The answer will probably be in the PRTG logs. Enable “Write EXE result to disk in case of error” in PRTG and the check the logs in “C:\ProgramData\Paessler\PRTG Network Monitor\Logs\sensors”. It will write 2 files. You want the one “Result of Sensor xxxx.txt”.
This shows exactly what PRTG is trying to import. It will also capture any error messages that the script may be throwing. Chances are this will tell you exactly what is going wrong.
Let me know how you go.
I had the same issue. My PRTG was freshly installed only yesterday in my lab network.
Resolution steps:
-> Run PowerShell as administrator (PowerShell x86)
-> Set execution policy to RemoteSigned (Set-ExecutionPolicy RemoteSigned)
-> Verify the script can run without issues and returning values in XML format
-> Scan now in PRTG sensor
Greig, thanks heaps for this mate, appreciate the script and the steps in getting it running in PRTG!
Hi, I need help because apparently the file is working normally but PRTG is accusing the same error.
“XML: The returned XML does not match the expected schema. (code: PE233) – JSON: The returned JSON does not match the expected structure (Invalid JSON.). (code: PE231) ”.
I enabled “Write EXE result to disk in case of error” but no log was generated.
I also tried the steps below and it didn’t work:
-> Run PowerShell as administrator (PowerShell x86)
-> Set execution policy to RemoteSigned (Set-ExecutionPolicy RemoteSigned)
-> Verify the script can run without issues and returning values in XML format
-> Scan now in PRTG sensor
This was the file generated when running ps1 manually:
http://dontpad.com/xmlspeedtestprtg
Thanks,
The result written to the file looks almost perfect, although I do note lots of extra spaces around the data that don’t appear when I run the script manually. I’m not sure why they would appear and if they are what’s upsetting PRTG. What Operating System and PowerShell version are you running the script on?
I’d suggest going into the Sensor Settings and set the Result Handling to “Store result”. That way PRTG will always log the result if it thinks it’s failed or not. That may provide a clue. If the stored result also shows extra spaces, it would be worthwhile tracking down where they come from.
In fact it has no space, it was just the formatter that I used.
This is the format that is presented:
http://dontpad.com/xmlspeedtestprtg
OS: Win 10
PS Version:
PSVersion 5.1.19041.610
PSEdition Desktop
PSCompatibleVersions {1.0, 2.0, 3.0, 4.0…}
BuildVersion 10.0.19041.610
CLRVersion 4.0.30319.42000
WSManStackVersion 3.0
PSRemotingProtocolVersion 2.3
SerializationVersion 1.1.0.1
Thank you for all of your information. The procedure is precise and well detailed. It works perfectly!
Hello, I am experiencing the same error as David (PE231) and I followed Rocky’s recommendations.
when I look at the log file located in “C: \ ProgramData \ Paessler \ PRTG Network Monitor \ Logs \ sensors” I read this message: “At C: \ Program Files (x86) \ PRTG Network Monitor \ custom
sensors \ EXEXML \ New-OoklaSpeedTest.ps1: 84 char: 46
+ <meta name = "analytics-location" content = "/" & "lt; user-name" & "gt; /" & "…
+ ~
The ampersand (&) character is not allowed. The & operator is reserved for
future use; wrap an ampersand in double quotation marks ("&") to pass it as
part of a string. "
It is repeated several times.
I followed what Shamir says but I don't know how to check "Verify the script can run without issues and returning values in XML format".
Finally I still have the same error code.
Regards,
Probably the easiest way to test the script is to run it in Powershell ISE. That will show you exactly what the script is sending to PRTG. Just run the PowerShell ISE app on your PRTG machine, open the script and click Run Script. You might be able to identify some odd values in the output.
You should see the XML data with the various values for Upload Speed, Download Speed, etc. If you get an error at this point, then there’s something funky going on with the script. If you get good values in properly formatted XML then the problem is in PRTG.
If it looks like a problem with the script, create an issue on GitHub and we’ll take it from there. https://github.com/greiginsydney/New-OoklaSpeedTest.ps1/issues
I’ve just discovered that WordPress doesn’t like me pasting XML into comments, so it would be next to impossible to communicate properly here.
Thank you for the feedback Rocky,
I have tested the Powershell file twice. Once on the PC (W7 Pro) with PRTG and once on a PC (W10 Pro) without PRTG.
(PS Set-ExecutionPolicy RemoteSigned)
I had for the 2 tests the same answers below:
W7 with PRTG :
PS C:\Users\NG> C:\Program Files (x86)\PRTG Network Monitor\Custom Sensors\EXEXML\New-OoklaSpeedTest.ps1
At C:\Program Files (x86)\PRTG Network Monitor\Custom Sensors\EXEXML\New-OoklaSpeedTest.ps1:84 char:46
+ <meta name="analytics-location" content="/"&"lt;user-name"&"gt;/"&" …
+ ~
The ampersand (&) character is not allowed. The & operator is reserved for future use; wrap an ampersand in double quotation
marks ("&") to pass it as part of a string.
At C:\Program Files (x86)\PRTG Network Monitor\Custom Sensors\EXEXML\New-OoklaSpeedTest.ps1:84 char:61
+ C:\installation\scripts\PS\New-OoklaSpeedTest.ps1
Au caractère C:\installation\scripts\PS\New-OoklaSpeedTest.ps1:84 : 46
+ <meta name="analytics-location" content="/"&"lt;user-name"&"gt;/"&" …
+ ~
Le caractère perluète n’est pas autorisé. L’opérateur & est réservé à une utilisation future. Placez un caractère perluète entre
guillemets doubles ("&") pour que ce symbole soit considéré comme une chaîne.
Au caractère C:\installation\scripts\PS\New-OoklaSpeedTest.ps1:84 : 61
+ <meta name="analytics-location" content="/"&"lt;user-name"&"gt;/"&" …
+ ~
Thanks – Very useful script. Was meaning to write one myself and then found yours. Deployed and working well.
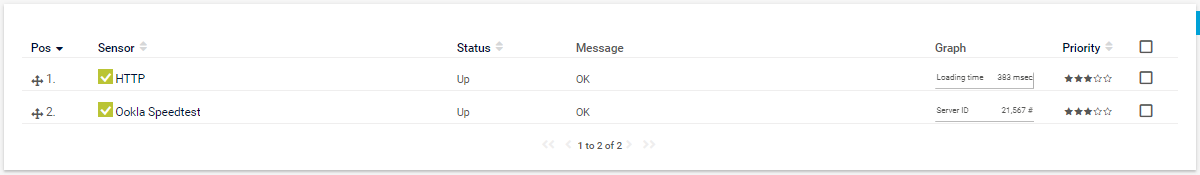
I have amended it to include the Server ID within the table view so I can see the server that was used for the test and just configured the channel so that its formatted correctly and not added to the chart.
Cheers
Hi
Thank you for this post. I have implemented in no time. :)
Many thanks ! I’ve been looking for this for a very long time!
It seems to be a well though script and I particularly like the run options eg “-AcceptGdpr” and thank you for “-Debug” :)))
I had some difficulties that I solved so I though I would share and help those “script enthousiast/amateur” like me.
Note that I’m not PowerScript educated, just enough to read/understand the code (not in details) and get help from google, read logs from both PRTG and your script via -Debug
Here is some additional info that could help :
1- get familiar with PowerShell security (Get-ExecutionPolicy). I’ve set it to “Bypass” for Local machine
2- check PowerScript version. v2 isn’t enough ;) – Win10 worked, Win7 (v2) needs to be updated.
Cheers!
Additional info: PRTG is using the 32bit version of PowerShell (x86). Set-ExecutionPolicy needs to be done in PowerShell (x86).
Never used PRTG but can we do this on a per-computer (device) basis? We need to track our remote users internet connectivity speeds.
If I understand what you are after, you have users, presumably connecting to you via a VPN, and you want to monitor their Internet speed.
PRTG does have a remote probe that can be installed on workstations and then speedtest.exe and the script can be copied and run on those machines, reporting back to PRTG’s server.
If your users aren’t connected to you somehow, you are probably out of luck with this particular script.
https://www.paessler.com/support/how-to/remote-probe-installation
Thanks – This fixed it for me!
Is it possible to add “-attempts” option to the script like it makes up to 2 or 3 attempts and then takes a best result out of 3 attempts? I don’t mean -retries option due to unreliable connection
Hi Tim,
That’s a difficult one to code. How would I determine what’s the “best” result out of ‘n’ attempts? The fastest down/up speed, the lowest ping time, or something else?
Isn’t it the whole point of PRTG to graph how reliable or otherwise your connection is?
– G.
it might be determined by definition of a some flag in the sensor parameter value like -d for best download, -u for upload, -p for ping, -l for latency, -j for jitter. But by default it would be defined as best download speed
I believe that the most of people using speedtest to see the best value of down/up speed and the other case is to checking SLA. And the speed can be quite different between the several attempts. For me from 1 to 3 attempts – that’s more that enough
Anyway I appreciate your work, thank you for it
Leave it with me and I’ll have a look at how much effort’s involved.
Thank you for your PRTG input/script but I see a strange behaviour on 1 of our remote servers :
When running a manual ookla speedtest I get download 147Mbps & upload 30,80Mbps
When configuring the PRTG sensor with your New-OooklaSpeedTest.ps1 I get download +700Mbps and upload +35Mbps – way to much download as the link has a max of 200 Mbps download.
How is this possible?
Hi Patrick,
Good question! I’d run the script manually and see what it outputs to the screen. That might help highlight where the discrepancy is coming from.
Alternatively, edit the sensor in PRTG to add the “-debug” switch, and then once you have some bad data, review the log file it creates (in the script’s folder) in the hope that the problem reveals itself.
Let me know how you go with it.
– Greig.
Sup Charles, go here and don’t right click and download the like. I think you downloaded the webpage for the ps1 and not the ps1 itself.
https://github.com/greiginsydney/New-OoklaSpeedTest.ps1/
Thanks Ryan.
The PRTG posts have encountered quite a lot of problems with people unfamiliar with GitHub saving the webpage and not the script itself.
Our recent posts have added a detailed walk-through of the process… I think i’ll retrofit same to these earlier ones.
– Greig.
Hi Greig,
I look after a company that has 2 x internet connections utilised simultaneously by a single router.
Which internet connection is used for what, is managed on the router by rules.
The company has a single onsite PRTG remote probe. I would like to regularly run a speed test and show results in PRTG for both connections.
The most likely way I think this may be possible would be if the source port(s) used on the probe could be specified per test and I could setup 2 test instances using different source ports (The load balancing router can route traffic based on source port).
I do not know what the Ookla api can and cannot do so maybe it’s not possible, but thought I would ask.
I have ruled out an additional remote probe at this stage and if I route the single remote probe test based on a schedule, I can’t see how to separate the results into 2 separate sensors.
– Gareth.
Hi Gareth,
If I understand your requirement correctly, I think this is easily accommodated by choosing different target servers for each instance, then in the router add source and dest rules so each target (IP) is routed to the appropriate internet connection.
Here’s all the local severs for me at the moment:
PS C:\Program Files (x86)\PRTG Network Monitor\Custom Sensors\EXEXML> .\speedtest.exe -L
Closest servers:
ID Name Location Country
==============================================================
15132 Aussie Broadband Sydney Australia
31279 TasmaNet Pty Ltd Sydney Australia
12492 Telstra Sydney Australia
1267 Optus Sydney Australia
44735 GSL Networks Sydney Australia
13279 Exetel Sydney Australia
5744 Digital Pacific Sydney Australia
6355 AARNet Sydney Australia
20057 Launtel Sydney Australia
17618 Vocus Comm’s Sydney Australia
Pick two from your own list, and then in the Sensor Settings / Parameters field, add ‘-ServerId nnnn’.
If that doesn’t work, and your PRTG server happens to be multi-homed, it looks like you can get speedtest to choose a specific NIC. Check out the options revealed by .\speedtest.exe -help.
Let me know how you go with it.
– Greig.
Hi Gareth
Thanks for the script it works perfect and very handy
When I run the script in powershell from the exexml folder, it runs fine and gives me a xml output. However, when I create the sensor, the output is the message from others – XML schema does not match expected. Also, the log files are there but the 2nd file with the output is empty. Anything I can try to make this work? I have double-checked the settings to the pictures in the documents to ensure I added the sensor correctly. The only thing different is that when I run in powershell I have to run the ps1 file preceeded by ./ – could it be the PRTG is trying to execute the file just with the filename?
You can probably test if PRTG is trying to run the filename without the path by trying the “Demo Batchfile” that comes with PRTG. It’s also in the EXEXML directory. If it works, then it’s probably not a path problem.
Also, please confirm that both “New-OoklaSpeedTest.ps1” and “speedtest.exe” are in the “C:\Program Files (x86)\PRTG Network Monitor\Custom Sensors\EXEXML” directory.
In the meantime, I’ll see if I can find a way to replicate this. It has me a little stumped.
Hi,
I solved it with this setting.
Sorry if this is a known setting.
https://kb.paessler.com/en/topic/20443-powershell-32-bit-or-64-bit-and-execution-policy
Hi,
I am currently trying to add this to my PRTG but running into the below error.
“XML: The returned XML does not match the expected schema. (code: PE233) — JSON: The returned JSON does not match the expected structure (Invalid JSON.). (code: PE231)”
I have tried everything suggested in this forum and still no luck. When running the powershell on the same machine as PRTG I get an XMS that shows download speed etc. Also when configuring the sensor I have enabled the logs but I always get an empty file.
Bit stuck here, any support would be really appreciated :)
Thanks!
Hi Dylan,
It certainly sounds like the ‘execution policy’ is your issue: YOU’RE allowed to run the script, but PRTG is being blocked. Check out Yugi’s response above from 23rd December, 2023.
Hi Greg,
Thanks for getting back to me.
I have tried what Yuji linked but still getting the same error on PRTG, below are all my restriction policies so I’m not too sure if any of this needs to change?
Scope ExecutionPolicy
—– —————
MachinePolicy Undefined
UserPolicy Undefined
Process Undefined
CurrentUser Undefined
LocalMachine Unrestricted
Also, I’m running PRTG on Windows 11 so not sure if that has any restrictions or anything.
Thanks!
Hi Dylan,
There’s a Windows 11 now? (I joke). Way to introduce a nice wildcard into the deck!
What command are you running to get that ExecutionPolicy output? Given you can run the script correctly on its own but PRTG can’t, that’s still where this is leading me.
Hi Greig,
I’m following the steps that Yuji linked, to open Powershell 32bit, and then running “Get-ExecutionPolicy -List”.
Sorry if I’m being a bit dull with this, appreciate your help massively!
Thanks :)
Thought I’d put an update on this.
As my Execution Policy was already unrestricted I thought I’d start the install process again.
I re-installed the Speedtest CLI but didn’t open it on my machine, just places it in the EXEXML folder, then in PRTG I re-setup the sensor with the parameter of -AcceptGdpr and it is now working :)
Thanks Dylan that’s great news.
Maybe PRTG wasn’t able to find Speedtest then?? I’ve made a note to update the script to throw an error if that’s the case, which may help future Dylans…
Happy speedtesting!
Nope, it’s already there:
$message = ‘Speedtest not found in this directory. Aborting.’
Hi,
Me again.
This has been working amazingly on our PRTG server.
However, for some reason, the download speed results on PRTG are abnormally different to running a speedtest on the website.
For example, on the server, it’s saying our download speed is 50mbps but when running on the speedtest.net website we get upwards of 900mbps download as that’s what we pay for.
Any ideas to why this is happening?
FYI – It’s just download speed, upload speed to showing correctly.
Hey Dylan,
Have you tried running speedtest.exe from a CMD or PowerShell window? I’d want to check the raw data there reflects what PRTG is telling you.
Assuming the EXE and PRTG align, i can only assume that your ISP is treating web tests and exe tests differently. Lots of ISPs/carriers “fake” their speedtest results.
– greig.
Hot tip:
I’ve figured out how to trigger this script to run on a remote RaspberryPi using the PRTG Advanced EXE sensor, and without having to use a Multi-Platform Probe.
After installing powershell on the Pi, I had to make three minor alterations.
1. Manually download and unpack both the speedtest-cli app and New-OoklaSpeedTest.ps1 to /var/prtg/scriptsxml on the remote Pi
2. Add the following as the first line of the .ps1 script (above <#) to allow it to run from the native shell:
#!/usr/bin/env pwsh
3. edit line 180 to conform to linux-friendly name of the speedtest-cli executable:
Original: $SpeedTestExe = Join-Path -path $dir -childpath 'Speedtest.exe'
Change to: $SpeedTestExe = Join-Path -path $dir -childpath 'speedtest'
Now when I add the Addvanced SSH Script sensor to my Pi device on the PRTG host server, it finds the New-OoklaSpeedTest.ps1 (since it's loaded at /var/prtg/scriptsxml) and it runs perfectly.
Hope someone finds this useful!
Cheers,
Paul
Thanks Paul!
You’re welcome!
I have a question:
Where would I pass variables to speedtest? I’d like for it to run via a specific interface (vlan7). I can do this directly from the CLI by running
speedtest -I vlan7
But not sure where to add this in your script. Adding it as a variable in the PRTG Advanced EXE sensor returns an error, which I expected. Thoughts?
Hi Paul,
If it’s a permanent addition I’d just add it into this line like shown:
– Greig.
Thanks, Greig. That’s working perfectly.
Cheers!
Paul
A new wrinkle. I happened to run your script directly from the command line today and am seeing the following error (note that I’ve renamed the script to reflect edits I’ve been making. Also my line 309 = your line 308, since I add a line to the top).:
MethodException: /var/prtg/scriptsxml/humblepi-newOoklaSpeedtest-10-23-0-70.ps1:309
Line |
309 | … $Value = [math]::round($result.packetLoss, $precision);
| ~~~~~~~~~~~~~~~~~~~~~~~~~~~~~~~~~~~~~~~~~~~~~~~~~~~~~~
| Cannot find an overload for “round” and the argument count: “2”.
Tried it on another raspberry pi where I have it installed and got the same result. Thoughts?
I just installed this and got this error??
XML: The returned XML does not match the expected schema. (code: PE233) — JSON: The returned JSON does not match the expected structure (#O2). (code: PE231)
XML: The returned XML does not match the expected schema. (code: PE233) — JSON: The returned JSON does not match the expected structure (#O2). (code: PE231)
Just installed and get this error? Any ideas what I did wrong?
PS C:\Program Files (x86)\PRTG Network Monitor\Custom Sensors\EXEXML> .\New-OoklaSpeedTest.ps1
Download SpeedMb/s1493.311Upload SpeedMb/s1829.611Latencyms111.511Jitterms13.511Packet Loss%0011
PS C:\Program Files (x86)\PRTG Network Monitor\Custom Sensors\EXEXML>
Seems like its working from the powershell. But in the PRTG I get this
XML: The returned XML does not match the expected schema. (code: PE233) — JSON: The returned JSON does not match the expected structure (#O2). (code: PE231)
Hi Mark,
If you scroll back through the other comments here, this looks to be a common error. What’s your OS, and have you checked the execution policy?
– Greig.