Following the installation of our solar panels and Tesla PowerWall2 last year, we’ve been on a mission to add all the monitoring and measurement that we can conceive.
Two earlier posts focussed on the Enphase micro-inverters:
Now we have a script that focusses on the PowerWall: Get-PowerWallData.py. Like the others, this script feeds raw data into PRTG.
Features
This script uses the Tesla API to query your PowerWall/Gateway, so it’s retrieving the same data that you see in the Tesla app on your phone. Benefits of this are having your own personal copy/log of that data under your own control, and importantly, you can now *alarm* on any parameters that fall out of your expected range, or do so for too long a period.
We do however grab a couple of values that aren’t in the app:
Battery health
Another important metric we’re monitoring is the “nominal_full_pack_energy” value. That’s what the battery thinks is its capacity when full, which degrades over time.
The script takes this figure and the battery’s as-new capacity to calculate the remaining percentage of its new capacity. This is important to monitor, because under normal use, Tesla warrants (at least in AU?) the battery will have 70% of its initial capacity remaining after ten years. So as the battery ages you’ll definitely want to keep an eye on this one.
Battery Temperature
Regardless of whether your battery is inside or outside, it’s a good idea to keep an eye on its temperature, because extremes can be detrimental to its health.
Multi-battery support
In a multi-PowerWall installation, the script will report each battery’s health and temperature individually.
Pre-Requisites
I burnt more than a week trying to roll my own secure interface to the Powerwall before I stumbled across Jason A Cox’s version, and that’s what we’re using here.
It’s a doddle to install, but as with other modules, you need to logged in as the machine’s actual “Administrator” account, NOT merely that of a user who *belongs* to the Administrator’s group.
cd "C:\Program Files (x86)\PRTG Network Monitor\python\"
.\python.exe -m pip install pypowerwall
You also need Requests:
.\python.exe -m pip install requests
Finally, PRTG needs to be running on a release later than 22.2.77.2204:
PRTG Version 22.2.77.2204 broke compatibility with pip.exe install (to install Python packages). With this PRTG release we have removed support for this command to prevent unexpected errors. As of now the only supported way of installing a Python package to use Python Script Advanced sensor is python.exe -m pip install. Please also see our Knowledge Base article for more information about Python installation: https://kb.paessler.com/en/topic/90686.
Download and install the Script
You’ll find the script Get-PowerWallData.py on Github.
If you’re unfamiliar with navigating GitHub, I screen-grabbed the process in my previous post, Get-EnphaseProduction.py.
The script file needs to be on your PRTG server in the folder “C:\Program Files (x86)\PRTG Network Monitor\Custom Sensors\python”.
It’s not ideal, but the script requires you to hard-code the login to your PowerWall. The PowerWall isn’t particularly secure (given the password is written on its Gateway), so it’s not a major sin to do it this way. Edit these dummy values with your own:
# Credentials for your PowerWall - Customer Login Data
password='ABCD1234'
email='example@example.com'
You also need to set your local timezone:
timezone = "Australia/Sydney" # Your local timezone. Reference: https://en.wikipedia.org/wiki/List_of_tz_database_time_zones
Finally, depending on the Tesla warranty in your market, you need to tell the script what the warranted as-new power output is. Here in Oz it’s 13.2kWh:
#Adjust this figure for your local market. This is used to calculate the Battery Health value
batteryNew = 13200 #Tesla warrants the battery as 13.2kWh in AU, as at 9 Feb 2017. See https://www.tesla.com/sites/default/files/pdfs/powerwall/Powerwall_2_AC_Warranty_AUS-NZ_1-0.pdf
Adding it to PRTG
This is exactly the same process as Get-EnphaseProduction.py. Just follow the steps here and report back when you’re done. I’ll wait.
Making it pretty
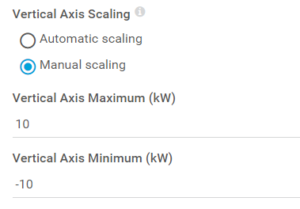
As usual, there are three things I like to do to make the graphs more readable. Firstly, edit the Grid, Battery, Home and Solar channels and set the Vertical Axis Scaling to a suitable number for your environment. As we have an 8.8kW system, 10kW seems like a nice round figure.
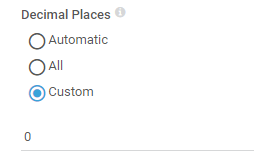
The second thing I do for each channel is to set decimal places to zero. This simply keeps the averages calculated under control, otherwise they are calculated to about 10 decimal places. Unnecessary.
Finally, choose your colour scheme. I went for orange for the sun, green for the battery, magenta for the grid and blue for home. It doesn’t really matter, just so long as it works for you.
Notification Triggers
We’ve not set up any notifications on the Grid, Battery, Home or Solar channels as these are obviously expected to swing wildly in daily use. Maybe you could set up a notification if you start using too much power for too long, just to remind you to turn a few things off.
The only real notifications we are interested in are the battery temperature and battery health.
The PowerWall2 specs tell us that it’s operating temperature is between –20°C and 50°C. It’s unlikely we are going to see any temperatures around –20°C in Australia, se we’ve set up a maximum only.
As the Australian warranty kicks in if the battery health drops below 70%, we’ve also set a notification on that. (You might consider alarming at 75% or thereabouts, to forewarn you that the dreaded figure is approaching.)
Now if the battery temperature goes over 50°C or the battery health drops below 70%, we’ll get an email.
References / Credits
- Jason A Cox’s pypowerwall.
- Tesla PowerWall 2 – Local Gateway API documentation.
Revision History
26 January 2023. This is the initial publication.
– G.


