Build it
Log it
Visualise it
captureKNX is software installed on a Raspberry Pi 5 that will (in conjunction with a HAT that provides a physical interface) capture all KNX traffic to a database.
The installed ‘InfluxDB’ database and its companion visualisation software ‘Grafana’ will let you query this data from a browser any time.
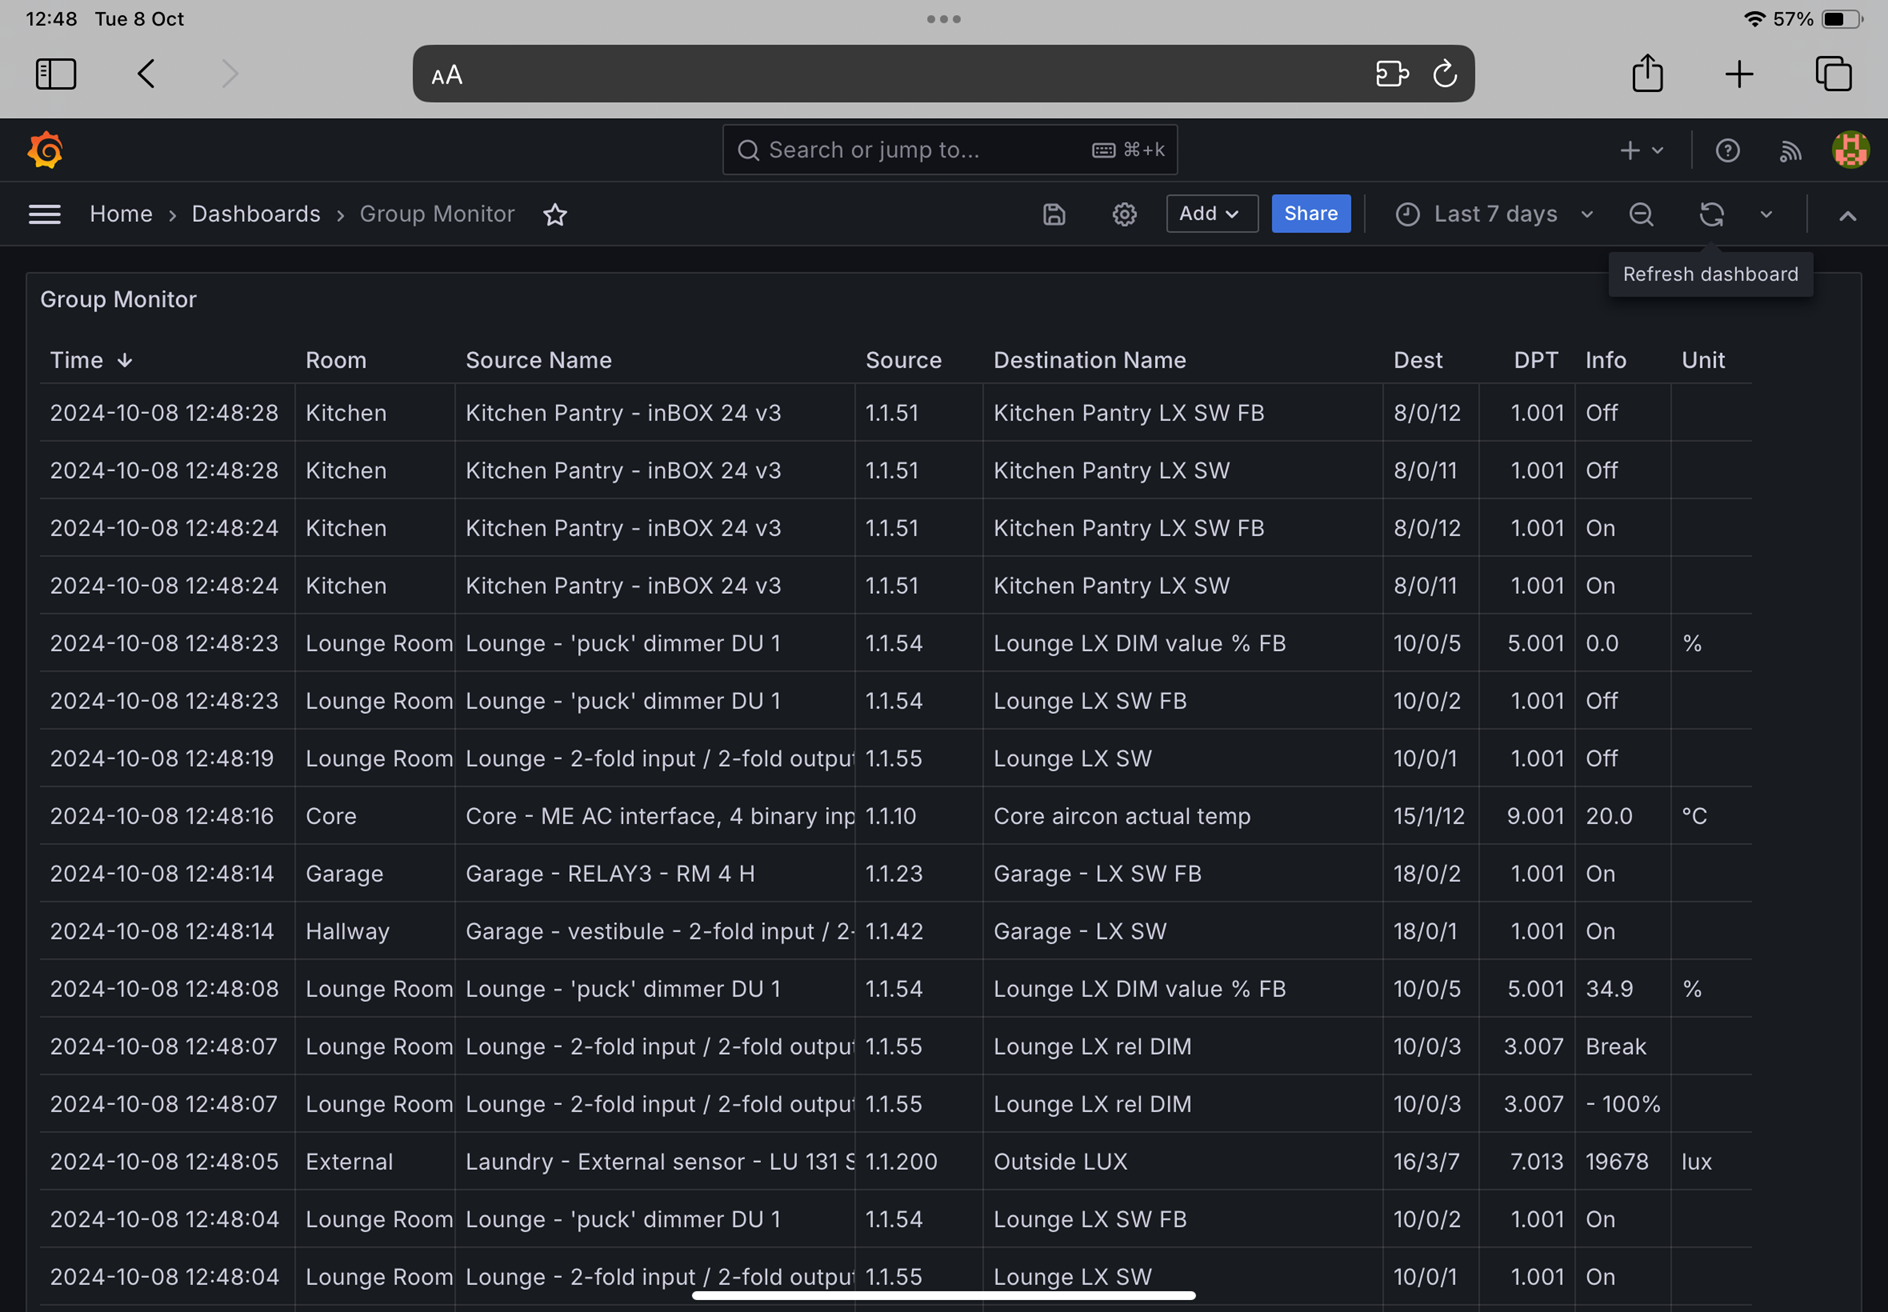
Whilst replicating ETS’ Group Monitor functionality, the power of the database as well as the graphing abilities in Grafana let you do a lot more with these captured telegrams.
capture-What?
If you’re new to KNX, check out my post Why KNX?
In short, it’s the building management platform we’re using here at home for the building automation and our ‘smart home’ controls.
Features
- Capture KNX telegrams for a year (or longer!) without needing to leave behind a laptop running ETS. (ETS6 will only capture 1,000 telegrams before over-writing them.)
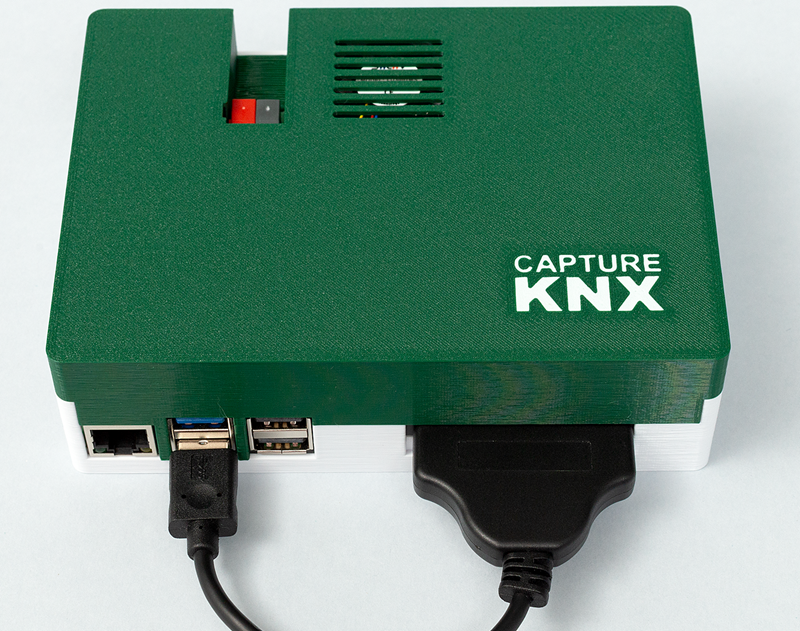
- No fancy hardware. Buy a Raspberry Pi 5, plug a KNX shield on top, add a solid-state drive, stick it in a box (artwork provided here to print your own) and apply power!
- No valuable ETS dongle left unguarded on site.
- Plugs directly into the KNX bus. This means KNX telegrams aren’t permanently spamming the IP network, and means you can capture tiny KNX installations that don’t have a full-time router or programming interface.
- Easy setup. A bash script installs all the software components. You only need to copy the topology/project file across after exporting it from ETS.
- A fully on-premises solution. Once you’ve bought the hardware, that’s your total outlay. (Late 2024 estimate circa $AUD250 / $US170 / €150.)
- A dedicated dashboard replicates ETS’ Diagnostics / Group Monitor feature. Debug your logic and other occurrences by filtering the captured view by time/date, Group Address, sending device or the value sent.
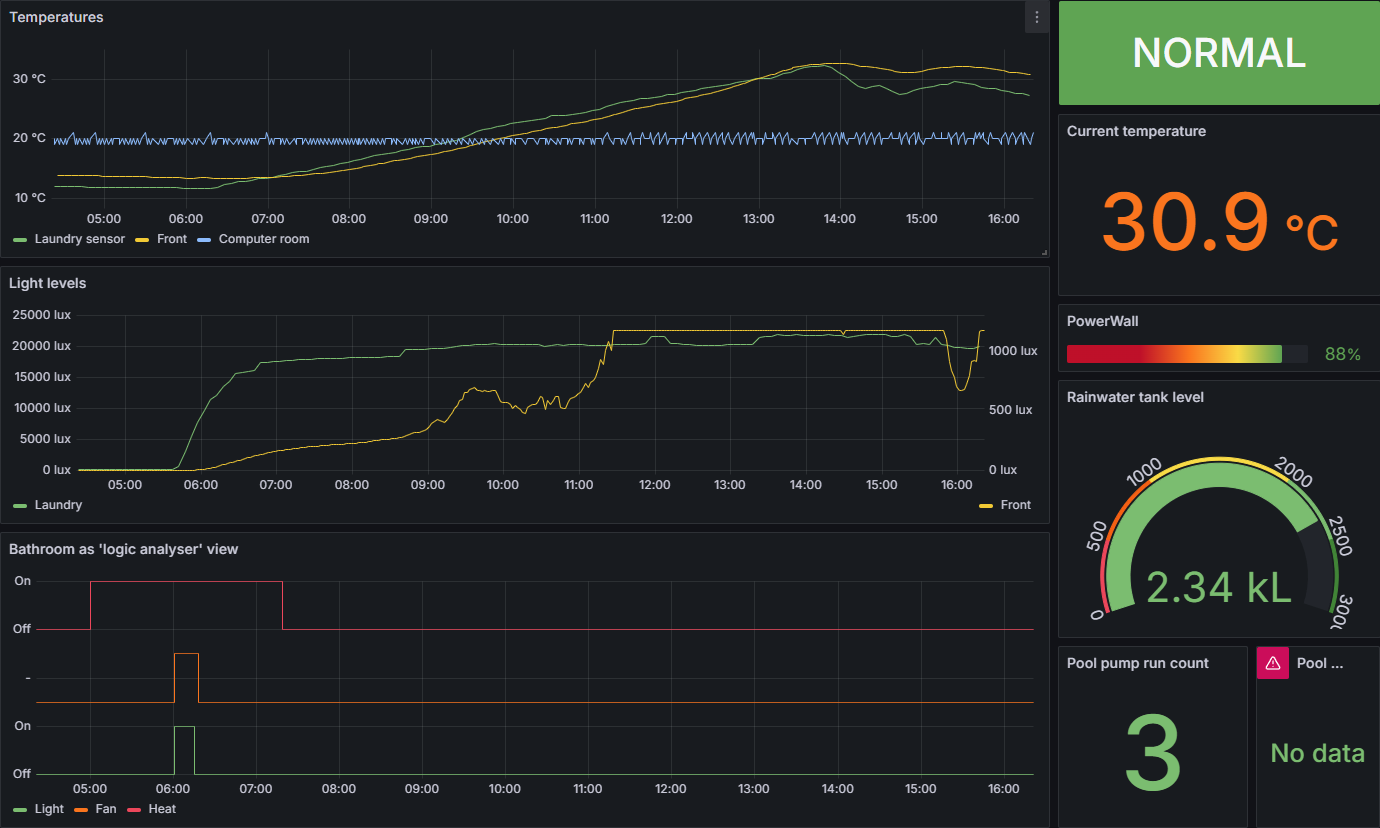
- With Grafana you can easily visualise data like daily temperatures or light levels, and overlay heating/lighting control signals.
- Hunting down bugs? Grafana can send you an alert when a specific telegram is seen!
Limitations / Restrictions
- The direct-connection to the KNX bus means it can only capture the telegrams seen on that network Line. This will prevent it from seeing all traffic in a multi-area or multi-line network (without extra configuration).
- It’s not an off-the-shelf product. You buy the components and build it yourself – but there’s heaps of documentation here to help you.
- Every telegram to a known Group Address is captured, however some esoteric DPT types might be misinterpreted or mis-represented. (Log an issue and we’ll work to resolve this.)
- If your installation is a works in progress, each time you create Group Addresses you’ll need to close/export/import the updated project file so captureKNX knows how to decode the incoming data. (Telegrams to unknown GA’s will be discarded.)
- (Currently) English-only, and hasn’t been tested in any other languages. Contributions welcome!
- KNX Secure is not supported. (This is a limitation imposed by knxd, which interfaces to and decodes the bus.)
Software architecture
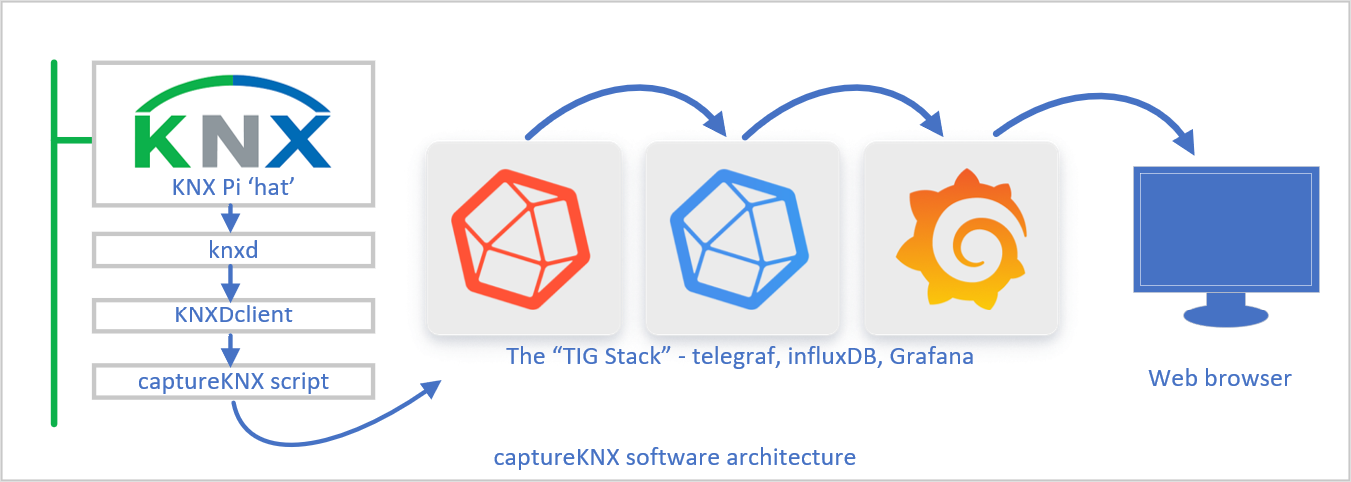
captureKNX is a consolidation of multiple open-source & freeware software components, all running on the one Raspberry Pi 5 single board computer.
The ‘HAT’ provides the physical interface to the KNX TP Line, and the ensuing components read and format the telegrams, then stuff them in the InfluxDB database. Grafana is the ‘visualisation’ component that lets you easily review and filter the raw logs, and/or create dashboards of useful values, all of which you access from a web browser. Preview the power of this here.
Where to next?
Everything’s over on GitHub:
- This is its landing page
- Shopping list
- Installation, commissioning, operating and troubleshooting docos
- FAQs
- The issues register
Revision History
2nd November 2024. Clarified the reference to KNX Secure support.
24th October 2024. This is the initial publication.
– Greig.


